The second solar spectrum is a complex spectrum caused by linear polarization of the limb radiation. Drs. Luca Belluzzi and Ernest Alsina Ballester, from Istituto Ricerche Solari Locarno (IRSOL), tell us more about it.

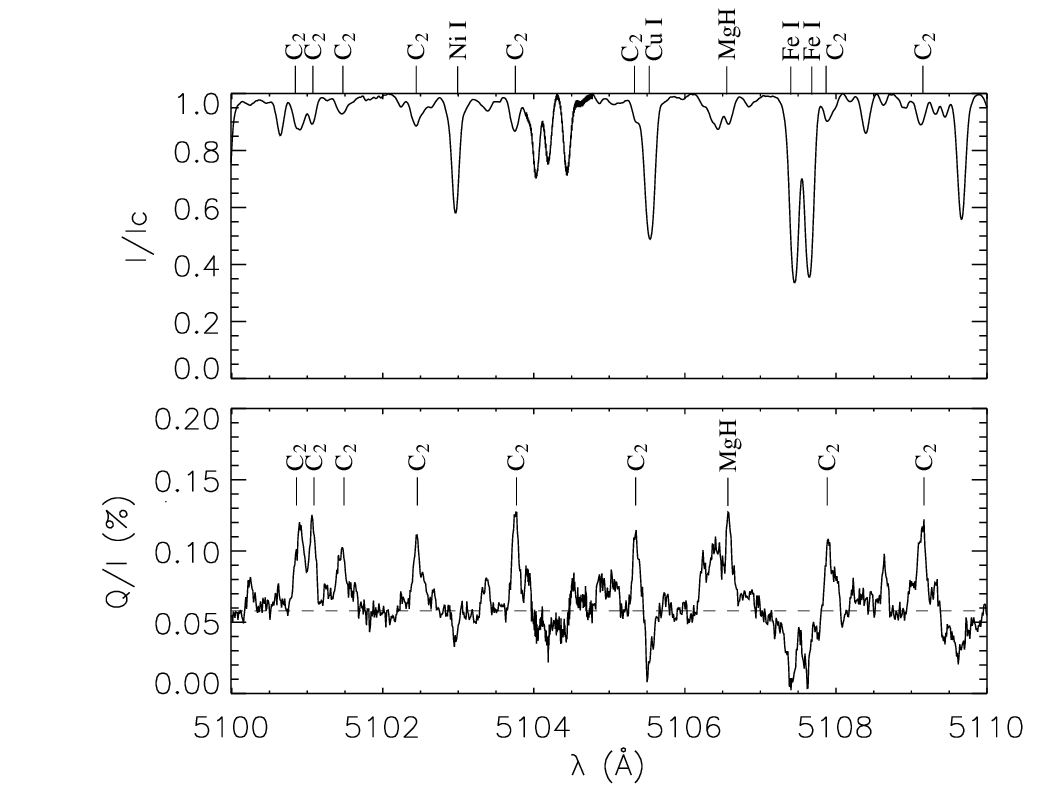
Intensity spectrum (upper panel) and Second Solar Spectrum (lower panel) in the wavelength interval between 510 and 511 nanometer. The Second Solar Spectrum is given in terms of fractional polarization, namely through the ratio between the Stokes parameter Q, which quantifies the linear polarization, and the intensity I. The dashed line in the lower panel represents the continuum polarization level. It can be observed that some strong spectral lines in the intensity spectrum just produce a "depolarization" of the continuum, while several molecular lines (C_2 and MgH), which can be hardly distinguished in the intensity spectrum, produce clear polarization signals. This observation was carried out at IRSOL using the Zurich Imaging Polarimeter (ZIMPOL). Data available on the IRSOL Data Archive: http://www.irsol.ch/data-a…/second-solar-spectrum-ss2-atlas/
Most of our knowledge about the solar atmosphere comes from the analysis of the light emerging from the Sun. The basic properties of light, and of electromagnetic waves in general, are its propagation direction, intensity, wavelength, and polarization.
As the human eye cannot perceive it, the polarization is certainly the less familiar of these properties. To understand it, one must recall that an electromagnetic wave is characterized by oscillating electric and magnetic field vectors that lie in the plane perpendicular to the propagation direction. The electric and magnetic fields can be arbitrarily oriented in such plane. The polarization is the characterization of this degree of freedom. The electric and magnetic fields may oscillate along a given direction or describe a circle. In these cases, one says that the radiation is linearly or circularly polarized, respectively.
Polarization should be expected whenever the physical processes involved in the generation of the EM radiation are not isotropic. An example is the anisotropy introduced by the presence of an external magnetic field. Interestingly, the radiation coming from non magnetized regions close to the edge of the solar disk (limb) is linearly polarized, parallel to the limb. The origin of this polarization is the scattering, by atoms and molecules, of the radiation propagating in the solar atmosphere, which presents some anisotropy, being more intense in the outward direction than in the inward one.
The degree of linear polarization of the limb radiation varies with wavelength, showing a complex spectrum called the "Second Solar Spectrum". This spectrum is very different from the usual intensity one. Many "strong" spectral lines in the intensity spectrum do not feature significantly in the Second Solar Spectrum, while many "weak" lines, produced by uncommon chemical species, such as rare earth elements or molecules, may give rise to large linear polarization signals, as shown in the accompanying figure.
The signals of the Second Solar Spectrum are sensitive to the presence of a magnetic field through a physical mechanism called Hanle effect. This mechanism allows investigating particular aspects of the solar magnetism, which remain hidden to more commonly used techniques. The Second Solar Spectrum thus represents a precious new diagnostic window for investigating the solar atmosphere, most notably regarding its magnetic properties.
So much physics in such faint signals
The second solar spectrum represents a new window not only for studying the solar atmosphere, but also for gaining new insights into the physics of matter-radiation interaction. Indeed, certain features of this spectrum are signatures of quantum phenomena occurring at the atomic level that cannot be reproduced in the laboratory, as they only show up in an extended plasma like the solar atmosphere.
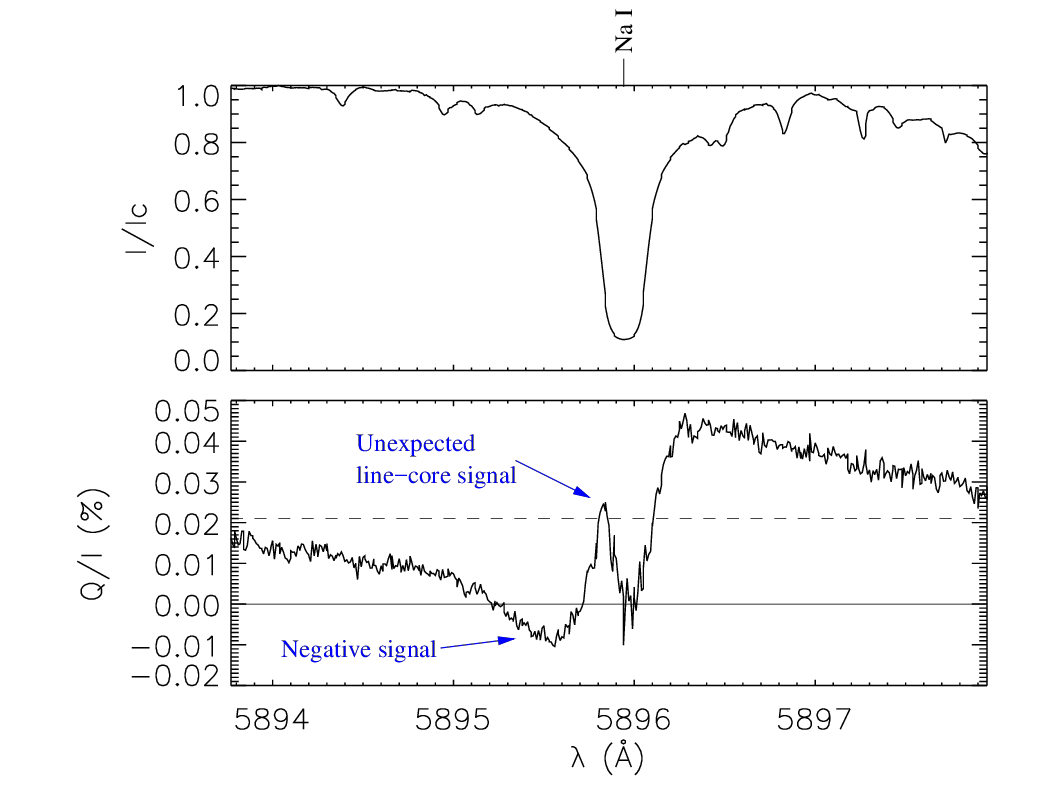
An interesting example is the negative signal -indicating a change of the linear polarization from parallel to perpendicular to the limb- that appears close to the neutral sodium line at 589.6 nm (see accompanying figure). In addition, the second solar spectrum presents some enigmatic signals whose interpretation has puzzled solar physicists for years, leading to significant contributions to the theory. The most famous example is the signal observed in the core of the neutral sodium line at 589.6 nm (see accompanying figure).
With few exceptions, the polarization signals of the second solar spectrum are weak, which explains why this spectrum has been unveiled only recently, thanks to the development of polarimeters with sufficiently high sensitivity. However, with the currently available telescopes, most of the details of the second solar spectrum can be detected only by sacrificing the spatial and temporal resolution of the observations. To reach the required sensitivity, one generally needs to make exposures of several minutes (during which the observed solar structures may evolve), and to average over large areas of the solar atmosphere (thus losing information about specific structures).
With the European Solar Telescope - EST, it will finally be possible to conjugate high spatial and temporal resolution with increased polarimetric sensitivity. This will dramatically increase the diagnostic potential of this spectrum, and we can safely bet that new unexpected features will appear, thus opening new challenges, possibly laying on the border between solar and theoretical physics.

The image shows the intensity spectrum (upper panel) and second solar spectrum (lower panel) of the Na I D1 line at 589.6 nm. The linear polarization profile in the second solar spectrum shows an overall anti-symmetric pattern, and a clear signal in the line-core region. Such line-core signal was not expected, and its theoretical interpretation is still debated. Note also the negative signal at shorter wavelengths, discussed in the text. This observation was carried out at Istituto Ricerche Solari Locarno with the Zurich Imaging Polarimeter (ZIMPOL).
