C. J. Nelson
European Space Agency (ESA), European Space Research and Technology Centre (ESTEC), Keplerlaan 1, 2201 AZ, Noordwijk, The Netherlands
R. J. Campbell, M. Mathioudakis
Astrophysics Research Centre, School of Mathematics and Physics, Queen's University Belfast, Belfast BT7 1NN, UK
Pores are regions of strong magnetic field which appear dark against the bright solar photosphere. The magnetic field strength in pores can reach several kG, making these features ideal hosts for a range of magneto-hydrodynamic waves. Indeed, oscillatory signatures are now routinely detected in these structures in nearly every observable metric, including the velocity, area, intensity, and magnetic field. Most reported oscillations have periods below ten minutes (primarily as solar datasets having typical durations of around one hour), however, some researchers have identified long-period oscillations (periods above 10 minutes) which still require additional analysis. Here, we provide an overview of a recent paper [1] which reported apparent signatures of long-period oscillations in the magnetic field strength, inferred for the deep photosphere of a pore using the strong-field approximation [2]. These oscillations have large amplitudes (>100 G) and are spatially localised to regions smaller than 1 Mm in diameter. The specific physical mechanism responsible for these oscillations remains unknown.
Data And Methods
We study data collected using the GREGOR [3,4] Infrared Spectrograph’s [5] Integral Field Unit (GRIS-IFU) on 1st September 2019. GRIS-IFU sampled a 37 Å wide spectral window containing the Fe I 15648.5 Å line, which is highly sensitive to the magnetic field in the deep photosphere. The benefit of IFU instruments is that spectra can be sampled over a two-dimensional field-of-view simultaneously, with the cost being that the field-of-view is small. Therefore, information about a larger field-of-view must be built up through mosaicking (moving the field-of-view of the instrument between frames). For this experiment, we conducted a 3x3 mosaic to cover a field-of-view of 18"x9" (1" is approximately 725 km on the Sun) containing a small pore.
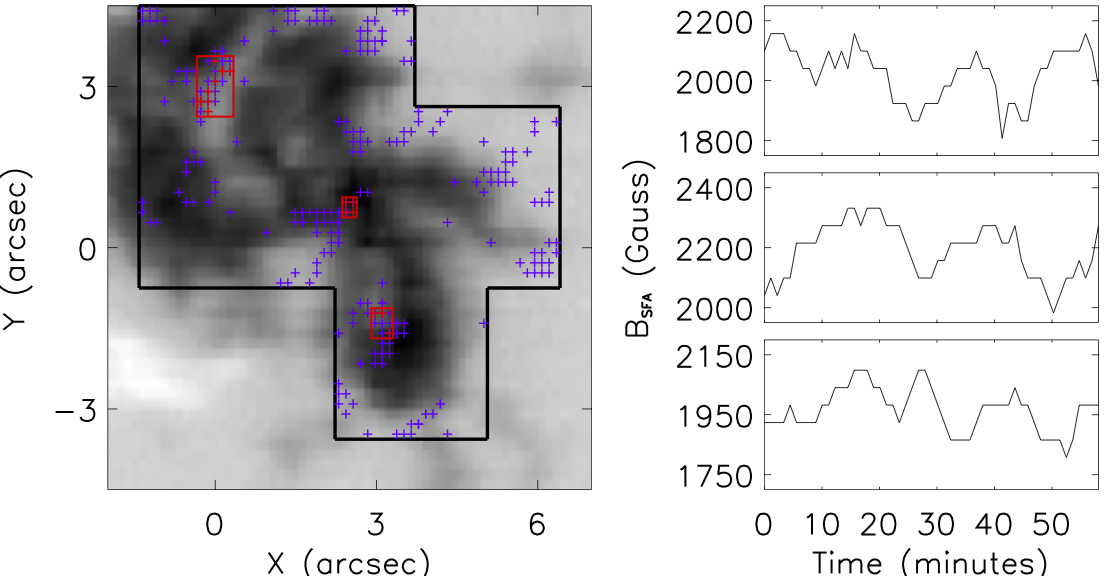
Figure 1. Left panel: The pore observed in Stokes V at 15647.6 Å. The black contours outline the pixels which were studied for evidence of long-period oscillations. The purple crosses indicate pixels which had significance from wavelet analysis but were deemed unclear after closer inspection. The red crosses, isolated in the three red boxes, indicate the 15 pixels which were selected for further analysis. Right panels: The magnetic field strength inferred through the strong-field approximation for three of the pixels indicated by the red crosses on the left panel. Long-period, apparently high-amplitude oscillations are clearly present for each pixel.
Detection Of Oscillations
Initially, we calculated estimates of the magnetic field strength for 1739 pixels (outlined by the black contour on the left panel of Figure 1) which were deemed to be within the pore throughout our time series. We used the strong-field approximation which, essentially, details that the field strength is proportional to the separation between the lobes of the Stokes-V profiles when the field is strong. An example of how this method is applied to Fe I 15648.5 Å Stokes-V profiles at one specific pixel within the pore is included in Figure 2. Wavelet analysis [6] was applied to the magnetic field signals and all pixels with significance above the 99% level within the cone-of-influence in the period window above 10 minutes were recovered (233 coloured crosses on the left panel of Figure 1). As these pixels contain examples where the significance was transient or located at the very cusp of the cone-of-influence, we then filtered this sample further to isolate those pixels which satisfied three criteria, namely that they: 1) were suitably far from the edge of the pore that changes in area would not impact the time series; 2) displayed amplitudes higher than the standard deviation of the inferred magnetic field (90 G), and; 3) that multiple clear periods were evident. This returned 15 pixels which were suitable for further analysis (red crosses on the left panel of Figure 1). These pixels displayed oscillations with apparently high amplitude, up to 210 G, throughout the studied time period. Time series for three of these pixels are plotted in the right panel of Figure 1 for reference.
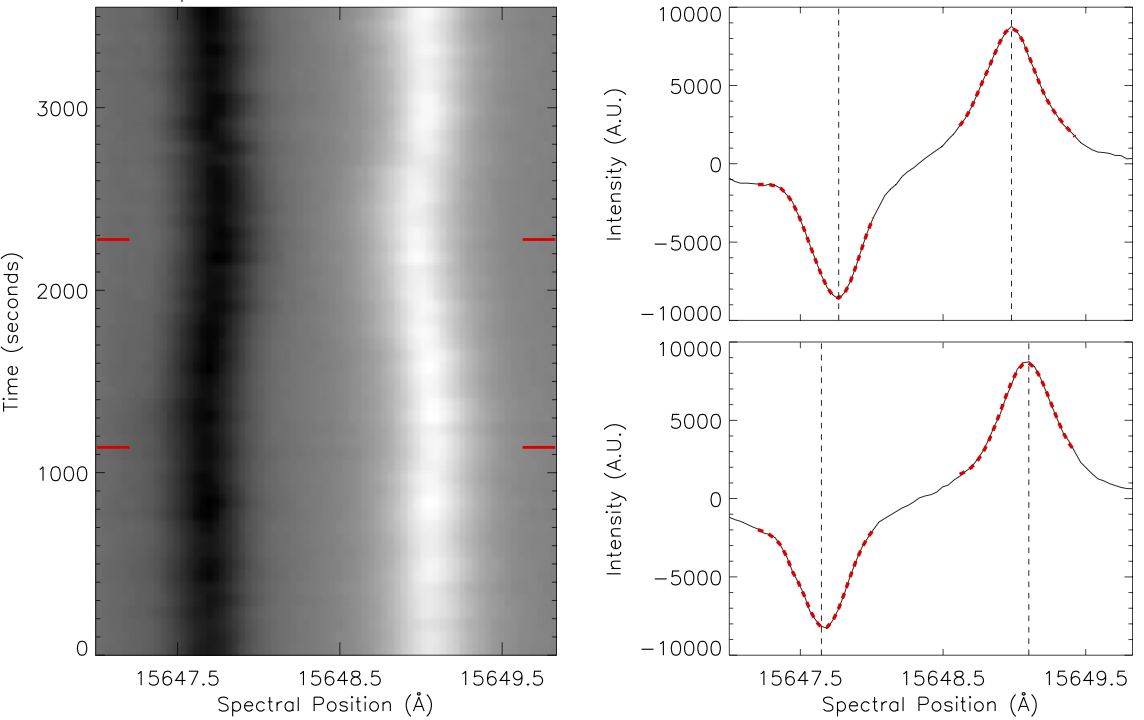
Figure 2. Left panel: The evolution of the Stokes-V profiles sampled by the GRIS-IFU around the Fe I 15648.5 Å line (x-axis) through time (y-axis) for a representative pixel within the pore. Right panel: The Stokes-V profiles at two time-steps indicated by the horizontal red dashes in the left panel. The difference in the separation of the lobes (which are traced by the dashed red lines and have their peaks highlighted by vertical dashed black lines) is immediately evident for these two time steps. Using the strong-field approximation, we infer magnetic field strengths of 1750 G for the top panel and 2100 G for the bottom panel.
Possible Explanations
Although the oscillatory signals within the inferred magnetic field are clear, the physical mechanism responsible for these signatures is not so easy to infer. Several possibilities are available which must be tested individually. For example, these changes in the field strength could be indicative of compression of the magnetic flux or changes in the filling factor of the magnetic field at one specific height in the solar atmosphere consistently sampled by the Fe I 15648.5 Å line, potentially caused by magneto-acoustic waves. Another possibility is that we are observing periodic changes in the inclination of the magnetic field through time at a specific height in the solar atmosphere, which could be a potential signature of Alfvén waves. Alternatively, we may be detecting changes in the optical depth with time, meaning the magnetic field strength could be constant and stratified but we sample different heights in the solar atmosphere in different temporal frames. Combinations of these effects are also possible. In Figure 3, we plot outputs from inversions constructed for one pixel using the Stokes Inversion based on Response functions (SIR; [7]) code. These inversions successfully display that each of the scenarios discussed previously is a possible explanation for these oscillations, but do not allow us to confidently isolate one specific cause.
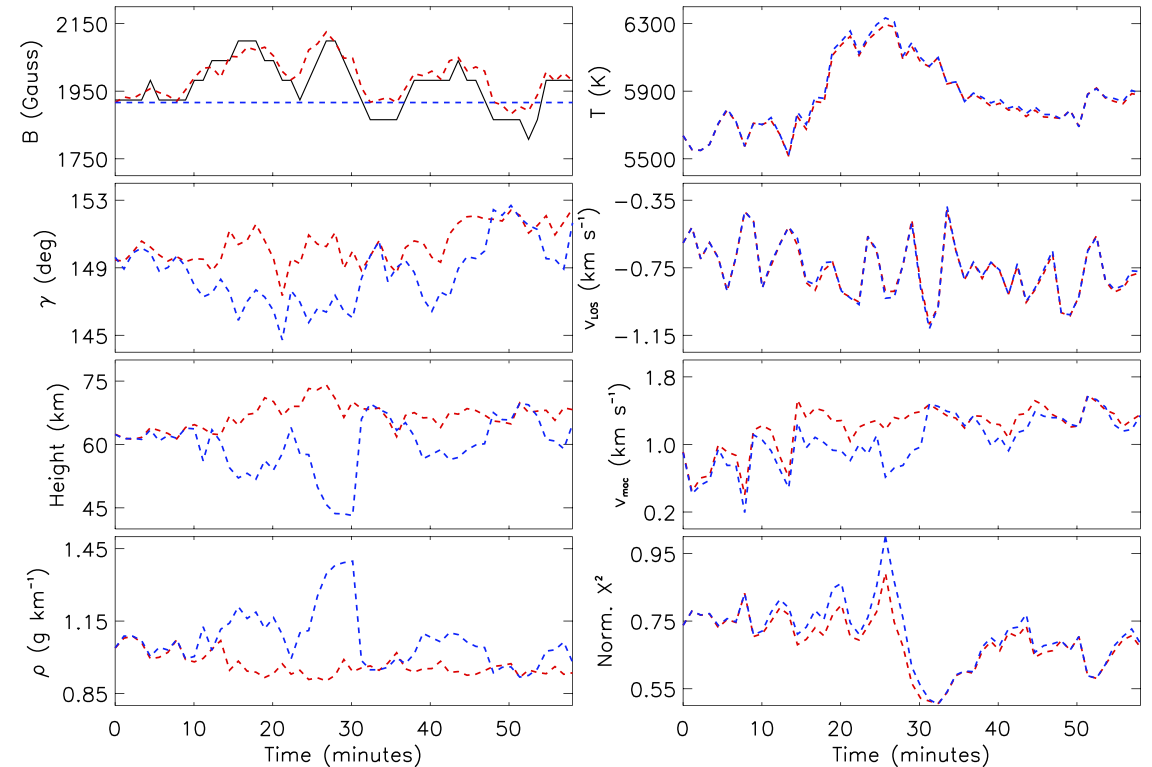
Figure 3. SIR results returned by two separate inversion schemes for an example pixel, selected from the 15 studied in detail. Red dashed lines display results from an inversion scheme where the magnetic field strength stratification was allowed to vary with time, whilst the blue lines display results where the magnetic field stratification was fixed. The red dashed line clearly tracks the long-period oscillation returned by the strong-field approximation (black solid line) in the magnetic field panel (top left), indicating that changes in the magnetic field strength at one particular optical depth may be responsible for these signals. The blue dashed line is constant as stipulated. No periodicity in the inclination (second from top left), height (second from bottom left), or density (bottom left) is detected for the inversion scheme where the magnetic field stratification is allowed to change. For the fixed magnetic field, however, some (anti-)correlation exists between each of these variables and the magnetic field inferred using the strong-field approximation. No potential evidence of long-period oscillations was detected in the temperature (top right), line-of-sight velocity (second from top right), macroscopic velocity (second from bottom right) for either scheme. Additionally, the χ2 fits for both schemes (bottom right) returned comparable results indicating these scenarios could be equally valid. These inversions clearly display that all the scenarios discussed (changes in the magnetic field density or filling factor, changes in the inclination of the magnetic field at a specific height, and changes in the height observed in the solar atmosphere) could explain these oscillations, but do not allow us to isolate one specific cause.
How Will Next-Generation Telescopes Help?
The next generation of ground-based solar telescopes, such as the Daniel K. Inouye Solar Telescope (DKIST; [8]) and the European Solar Telescope (EST; [9]), will play a key role in helping us understand these oscillations. The increased spatial resolution possible with 4-m class telescopes will allow us to investigate how the locations of these signals change with time, thereby helping us to infer the real cause behind the apparent oscillations (e.g., changes in the filling factor of the pixels). The increased spectral coverage provided, for instance by the multiple IFU set-up proposed for EST, will allow us to investigate the evolution of these signals at different heights in the solar atmosphere simultaneously thereby facilitating investigation of the role of opacity effects. Whilst we wait for the data, though, we must first analyse other pores to identify whether these oscillations are common or whether they are unique to this specific event.
References
[1] Nelson, C. J., Campbell, R., J., Mathioudakis, M., 2021, A&A, 654, A50
[2] Ulrich, R. K., 1996, ApJ, 465, 436
[3] Schmidt, W. et al., 2012, AN, 333, 796
[4] Kleint, L., et al., 2020, A&A, 641, A27
[5] Collados, M., et al., 2012, AN, 333, 872
[6] Torrence, C., & Compo, G. P., 1998, Bulletin of the American Meteorological Society, 79, 61
[7] Ruiz Cobo, B., & del Toro Iniesta, J. C., 1992, ApJ , 398, 375
[8] Rimmele, T. R., et al., 2020, Solar Physics, 295, 172
[9] Quintero Noda et al., 2022, A&A, submitted
Acknowledgement
The authors are indebted to C. Dominguez-Tagle, J. Rendtel, and M. Collados for their help with data collection and reduction. C.J.N. and M.M. are thankful to the Science and Technology Facilities Council for the support received to conduct this research through grant numbers ST/P000304/1 and ST/T00021X/1. This research data leading to the results obtained has been supported by SOLARNET project that has received funding from the European Union’s Horizon 2020 research and innovation programme under grant agreement no 824135. R.J.C. acknowledges support from the Northern Ireland Department for the Economy (DfE) for the award of a PhD studentship. The 1.5-m GREGOR solar telescope was built by a German consortium under the leadership of the Leibniz-Institute for Solar Physics (KIS) in Freiburg with the Leibniz Institute for Astrophysics Potsdam, the Institute for Astrophysics Göttingen, and the Max Planck Institute for Solar System Research in Göttingen as partners, and with contributions by the Instituto de Astrofísica de Canarias and the Astronomical Institute of the Academy of Sciences of the Czech Republic.