Theodosios Chatzistergos, Natalie Krivova, Kok Leng Yeo, Sudip Mandal, Sami K. Solanki (Max Planck Institute for Solar System Research, Göttingen, Germany)
Ilaria Ermolli (INAF - Osservatorio Astronomico di Roma, Rome, Italy)
Greg Kopp (Laboratory for Atmospheric and Space Physics, University of Colorado Boulder, USA)
Jean-Marie Malherbe (LESIA/Observatoire de Paris-Meudon and PSL Research University, Paris, France)
Earth receives most of its energy from the Sun (Kren et al. 2017), which makes the Sun an important natural driver of Earth’s climate (Solanki et al. 2013, IPCC 2021). To enable accurate assessment of the Sun’s influence on Earth’s climate, long-term records of the wavelength-dependent solar irradiance are needed. Total solar irradiance (TSI), which is the total radiative energy flux from the Sun at 1 AU outside of Earth’s atmosphere, has been measured since 1978 by a number of space-based experiments. Records of the spectrally resolved solar irradiance (SSI) are sparser. However, climate studies require significantly longer timeseries and therefore models are used to extend the available TSI and SSI records to the pre-satellite era. We show how historical archives of full-disc photographs of the Sun in the Ca II K line can help to improve reconstructions of past irradiance changes.
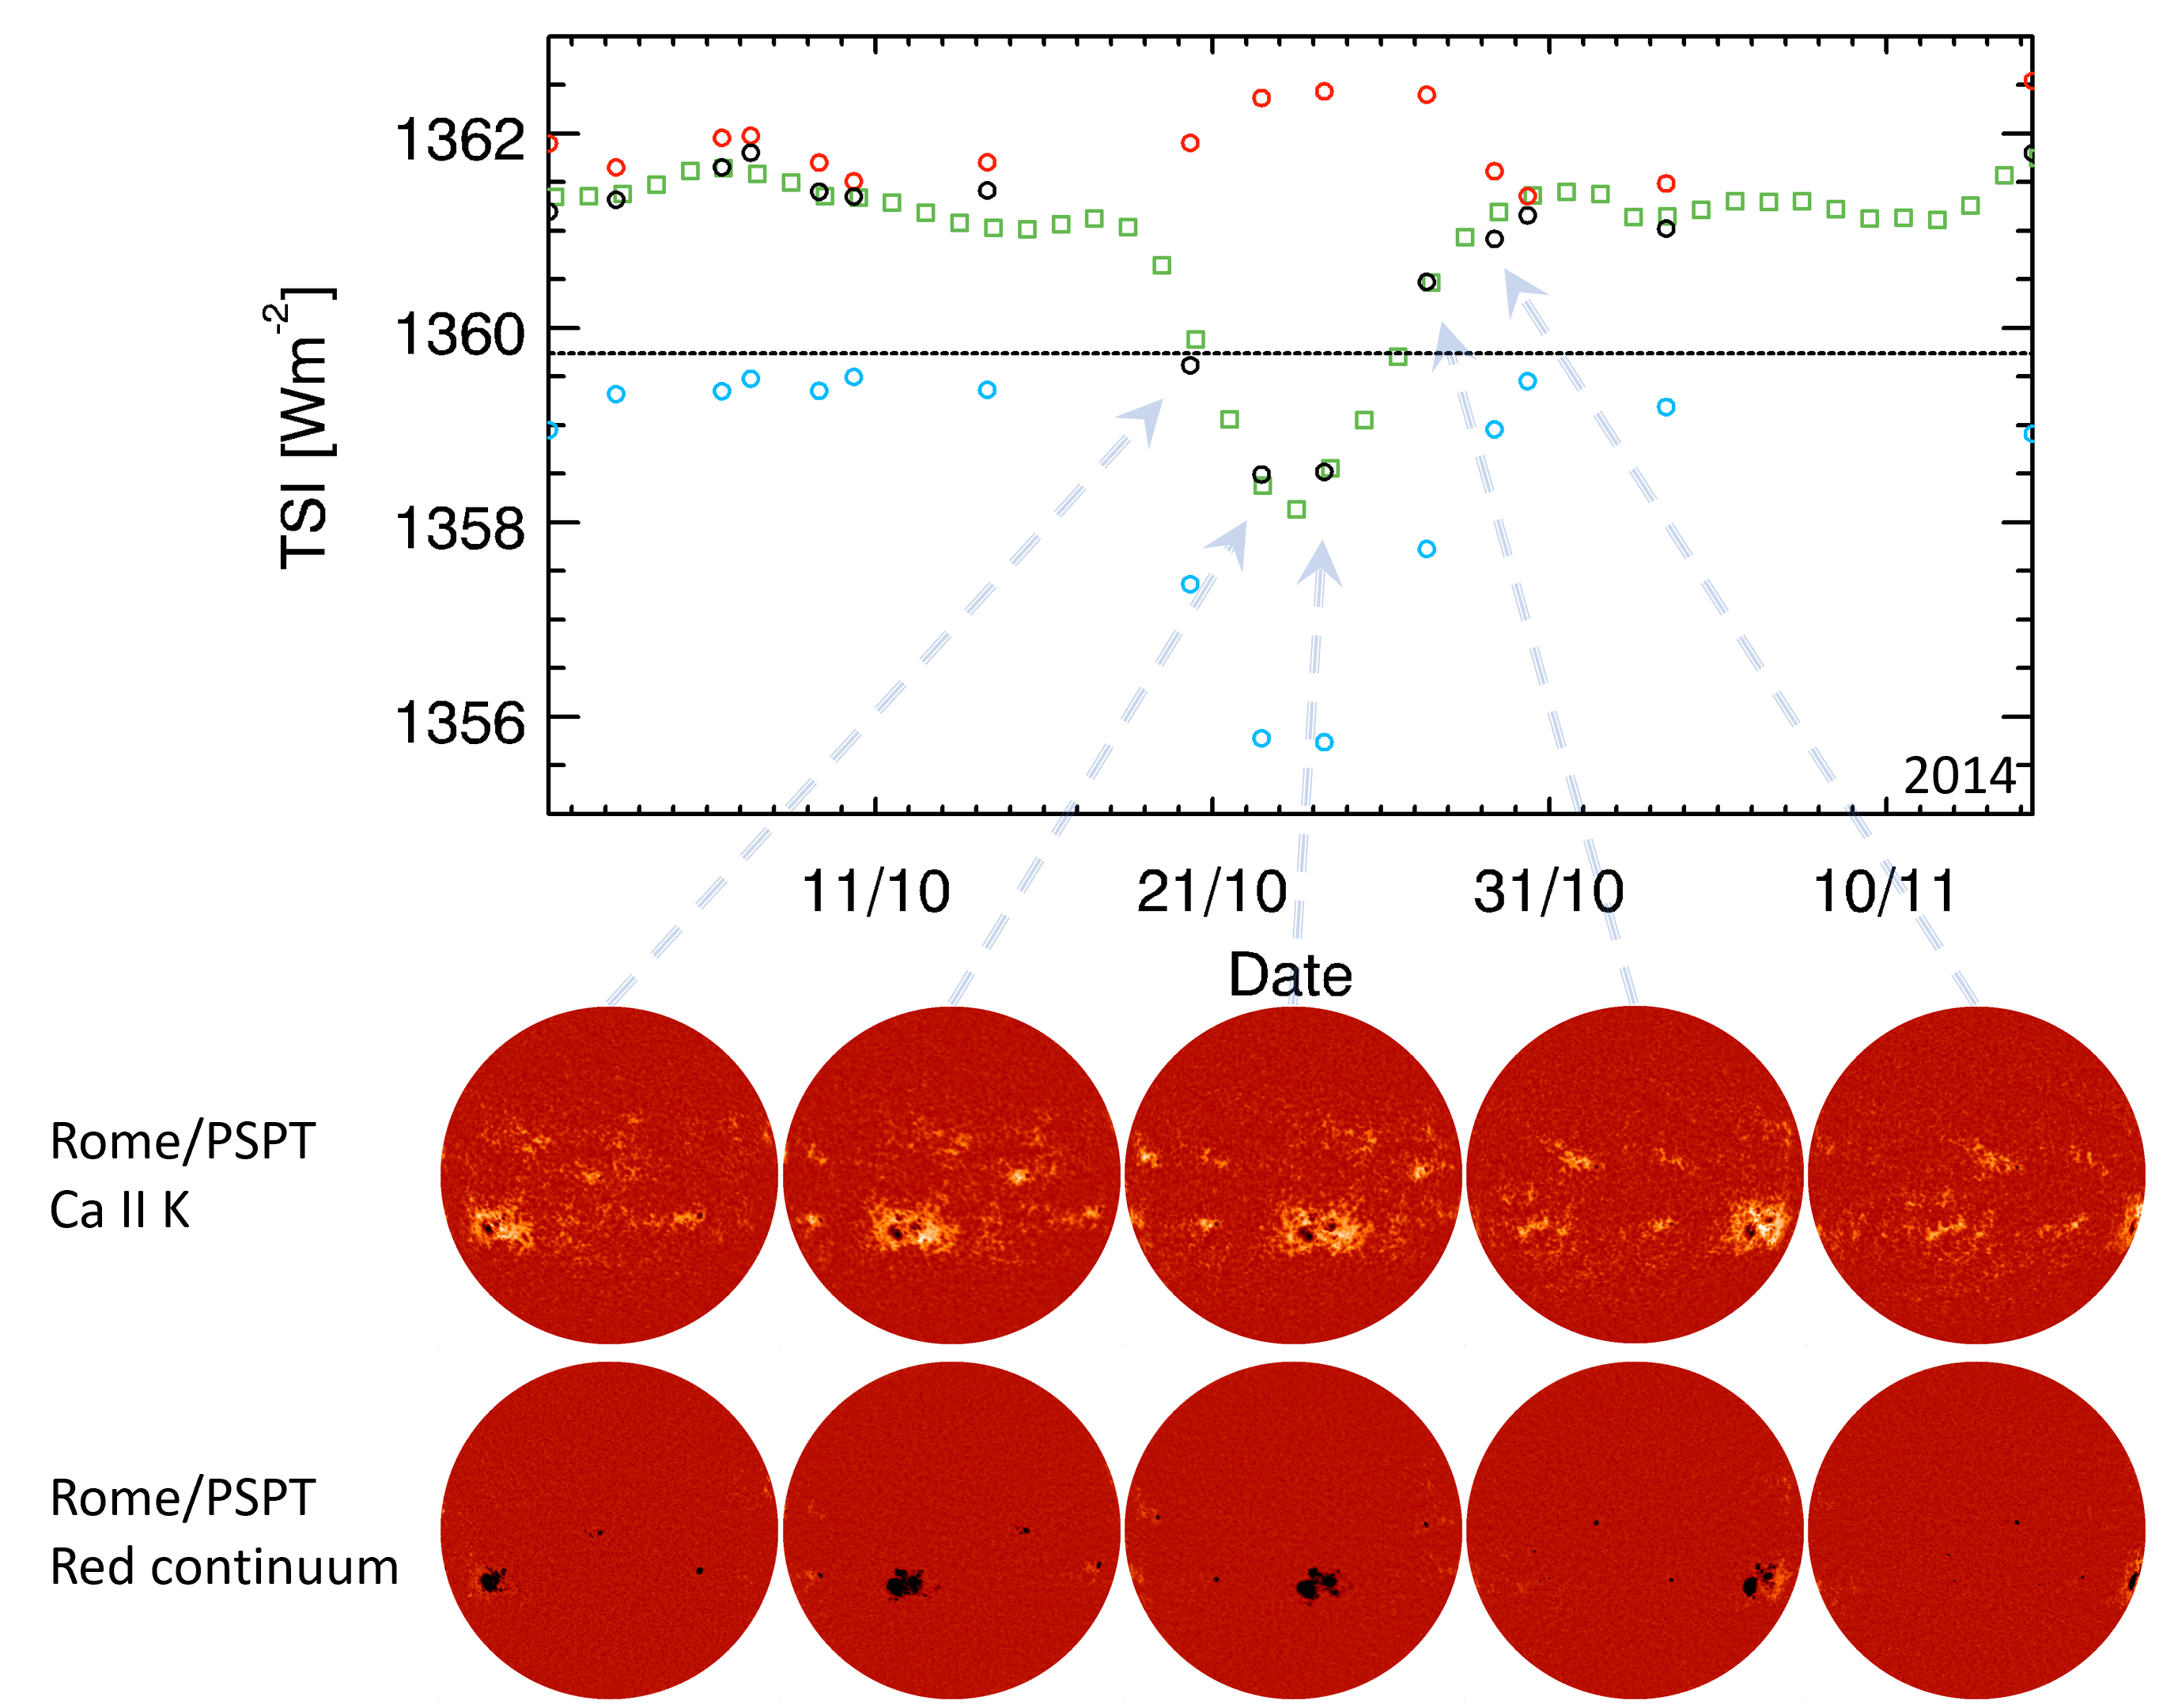
Figure 1. Top: Daily TSI values over a 6-week interval starting from 1st of October 2014 (around the maximum of solar cycle 24) reconstructed using the SATIRE model from Rome/PSPT Ca II K observations (black circles) and the PMOD composite of measurements (green squares). We also show the individual contributions of faculae (red) and sunspots (light blue), as deviations from the mean level of TSI at 1359.7 Wm-2 (dotted black line). Bottom: Full-disc Rome/PSPT observations in the Ca II K line (upper row) and in a red continuum band (lower row) on 5 days during the decrease in TSI, as marked in the upper panel. The images have been compensated for limb-darkening and oriented to show the solar north pole at the top.
Irradiance variations on climate-relevant timescales are driven by the evolution of the solar surface magnetic field (e.g. Yeo et al. 2017), as a competition between brightness depressions caused by sunspots and enhancements caused by faculae (see Fig. 1). Unfortunately, direct observations of faculae for the time prior to direct TSI measurements are scarce and unreliable, and irradiance reconstructions for earlier periods typically rely on either sunspot data alone or on cosmogenic radioisotopes to infer the properties of faculae. Both approaches are indirect and rely on many assumptions.
This can be overcome by using full-disc observations of the Sun in the singly-ionized Calcium line, referred to as Ca II K, which carry direct information on facular regions. Such observations have been stored on photographic plates since 1892 (Chatzistergos et al. 2020) and, more recently, performed with CCD cameras at various worldwide observatories. Despite the wealth of such data, they have not been fully utilized for long-term solar activity and irradiance studies. Many factors have contributed to this, foremost the lack of appropriate data to describe the non-linear response of the photographic emulsion to the incident light, but also a plethora of artefacts affecting the photographs, starting from the observing conditions and accumulated over the lifetime of the plates.
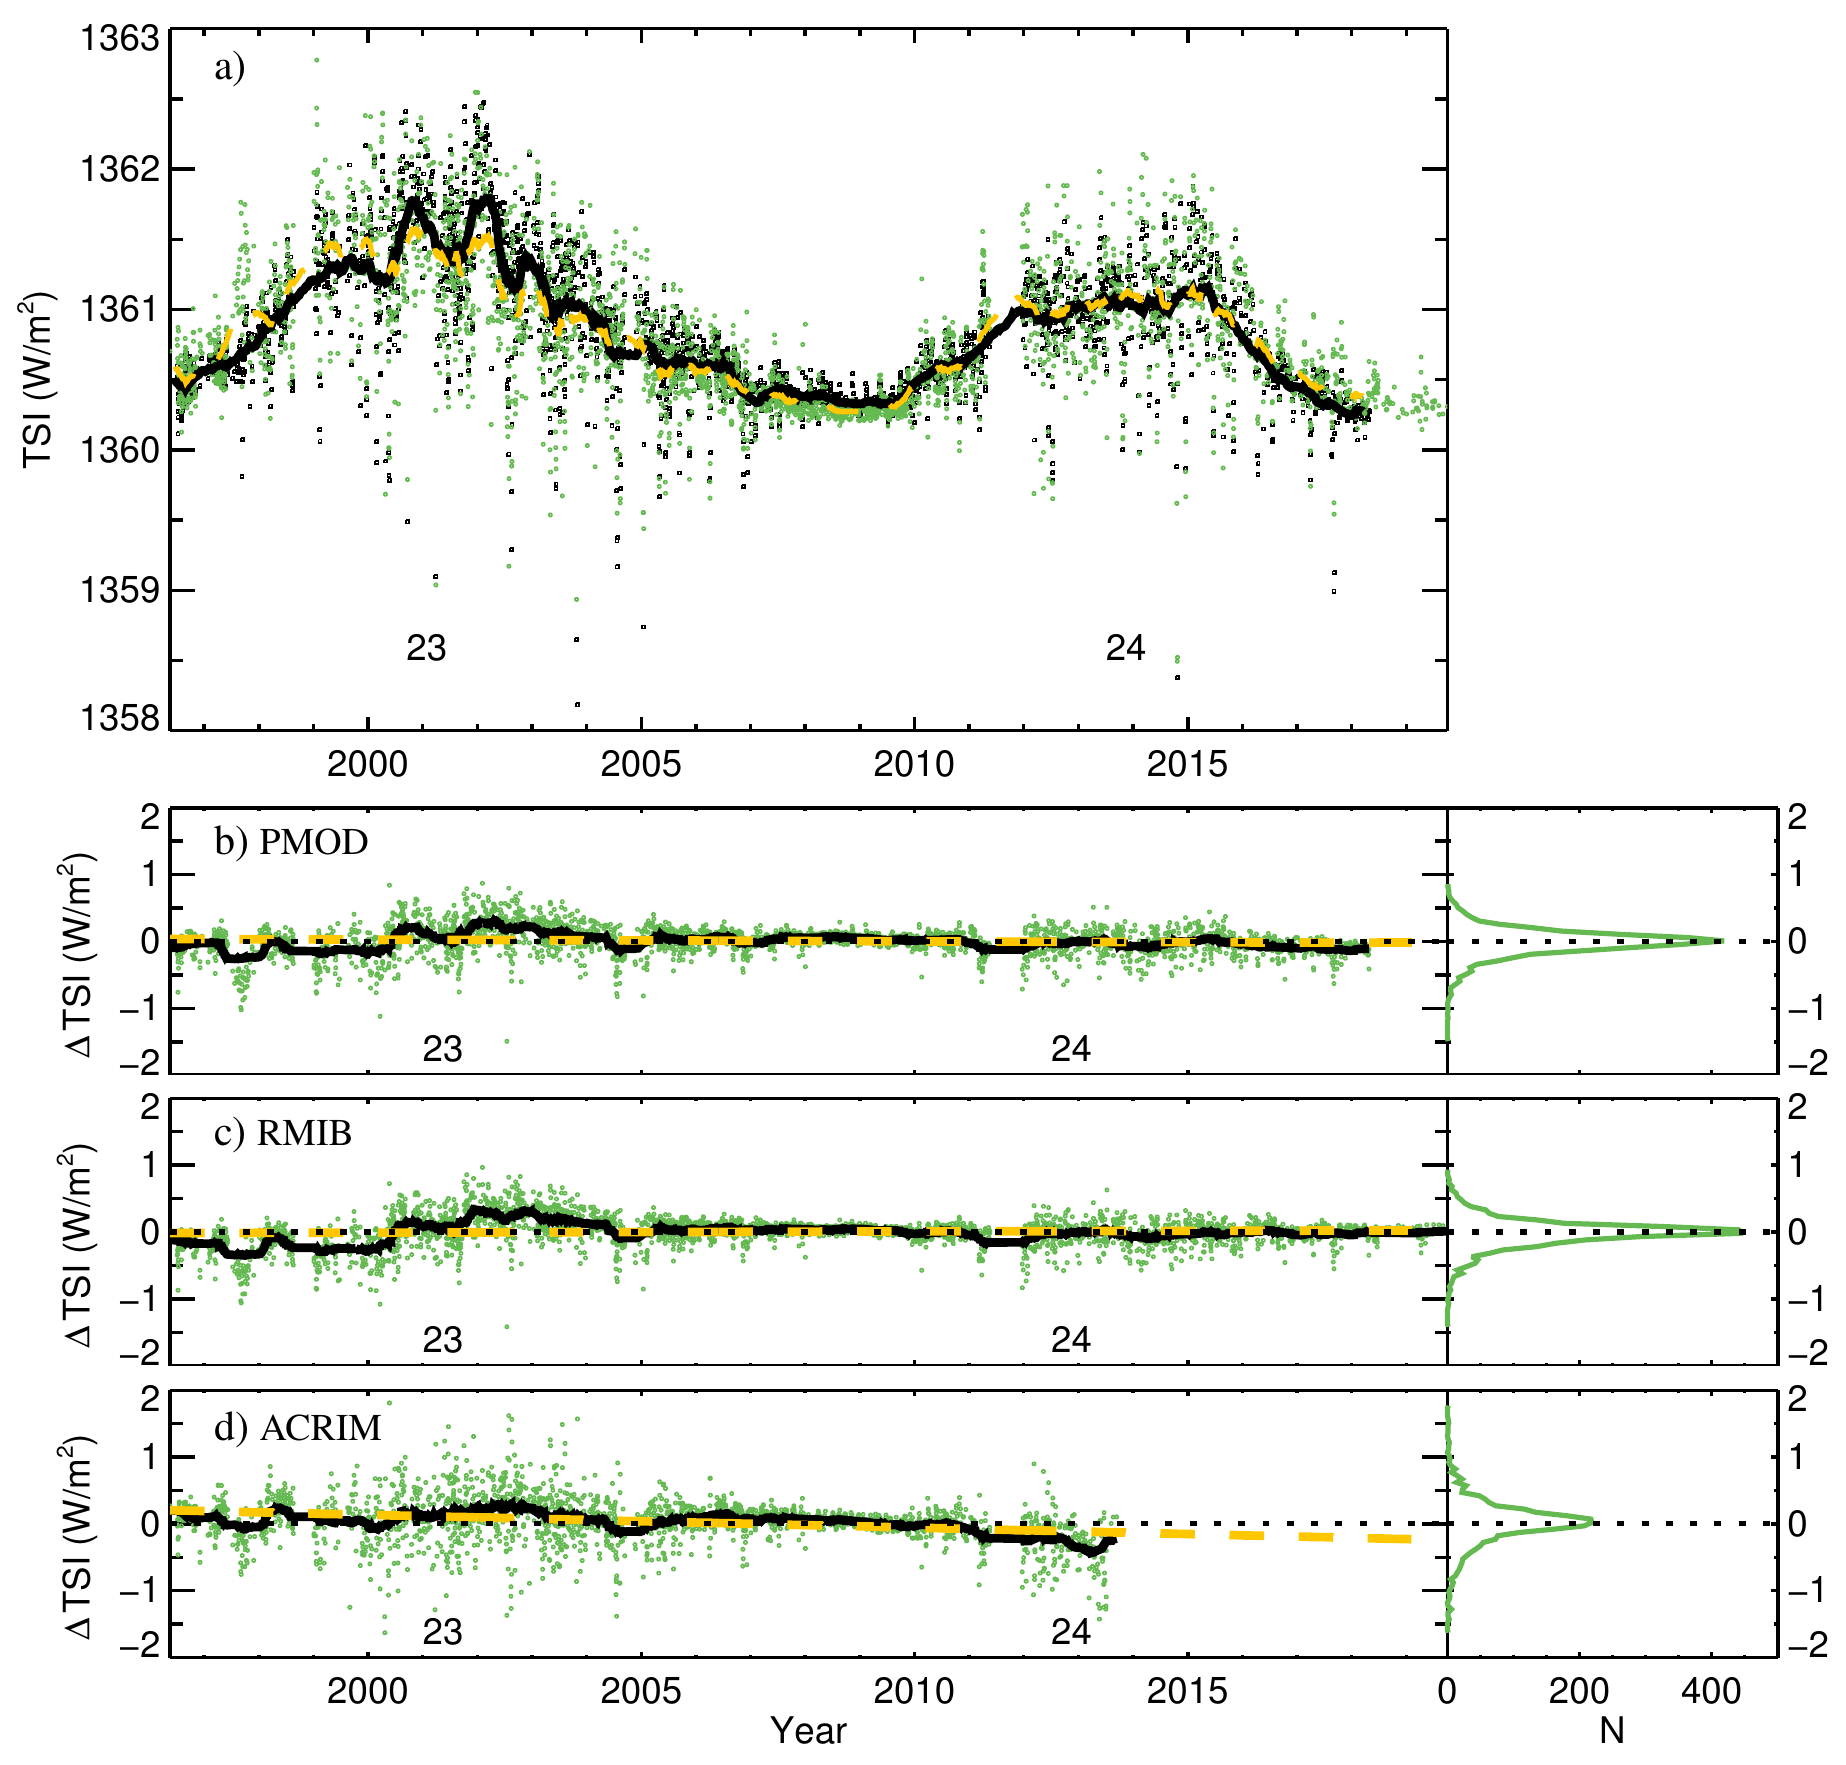
Figure 2. Panel (a) TSI variations reconstructed from Rome/PSPT Ca II K observations (green for daily and orange for 81-day running mean). Also shown are the values from the PMOD TSI composite (black). Panels (b)-(d) (left): Residuals between our reconstruction of TSI and the PMOD, RMIB, and ACRIM TSI composites (green for daily and black for 81-day running mean), respectively. The dashed orange line is a linear fit to the residuals, while the black dotted line is a line with no trend. Panels (b)-(d) (right): Distribution of residuals in bins of 0.05 Wm-2. The numbers at the lower parts of each panel denote the solar cycle number and are plotted approximately at times of activity maximum.
We have collected the most comprehensive set of Ca II K data from 38 observatories spanning the period since 1892 (Chatzistergos et al. 2020), corrected the images for various artefacts and compensated for limb-darkening. To account for the non-linear response of the plates, we have devised a photometric calibration approach (Chatzistergos et al. 2018). We have also used modern Ca II K observations to study the relation between the Ca II K brightness and the magnetic field strength, which enables a direct conversion of the Ca II K observations to magnetograms (Chatzistergos et al. 2019).
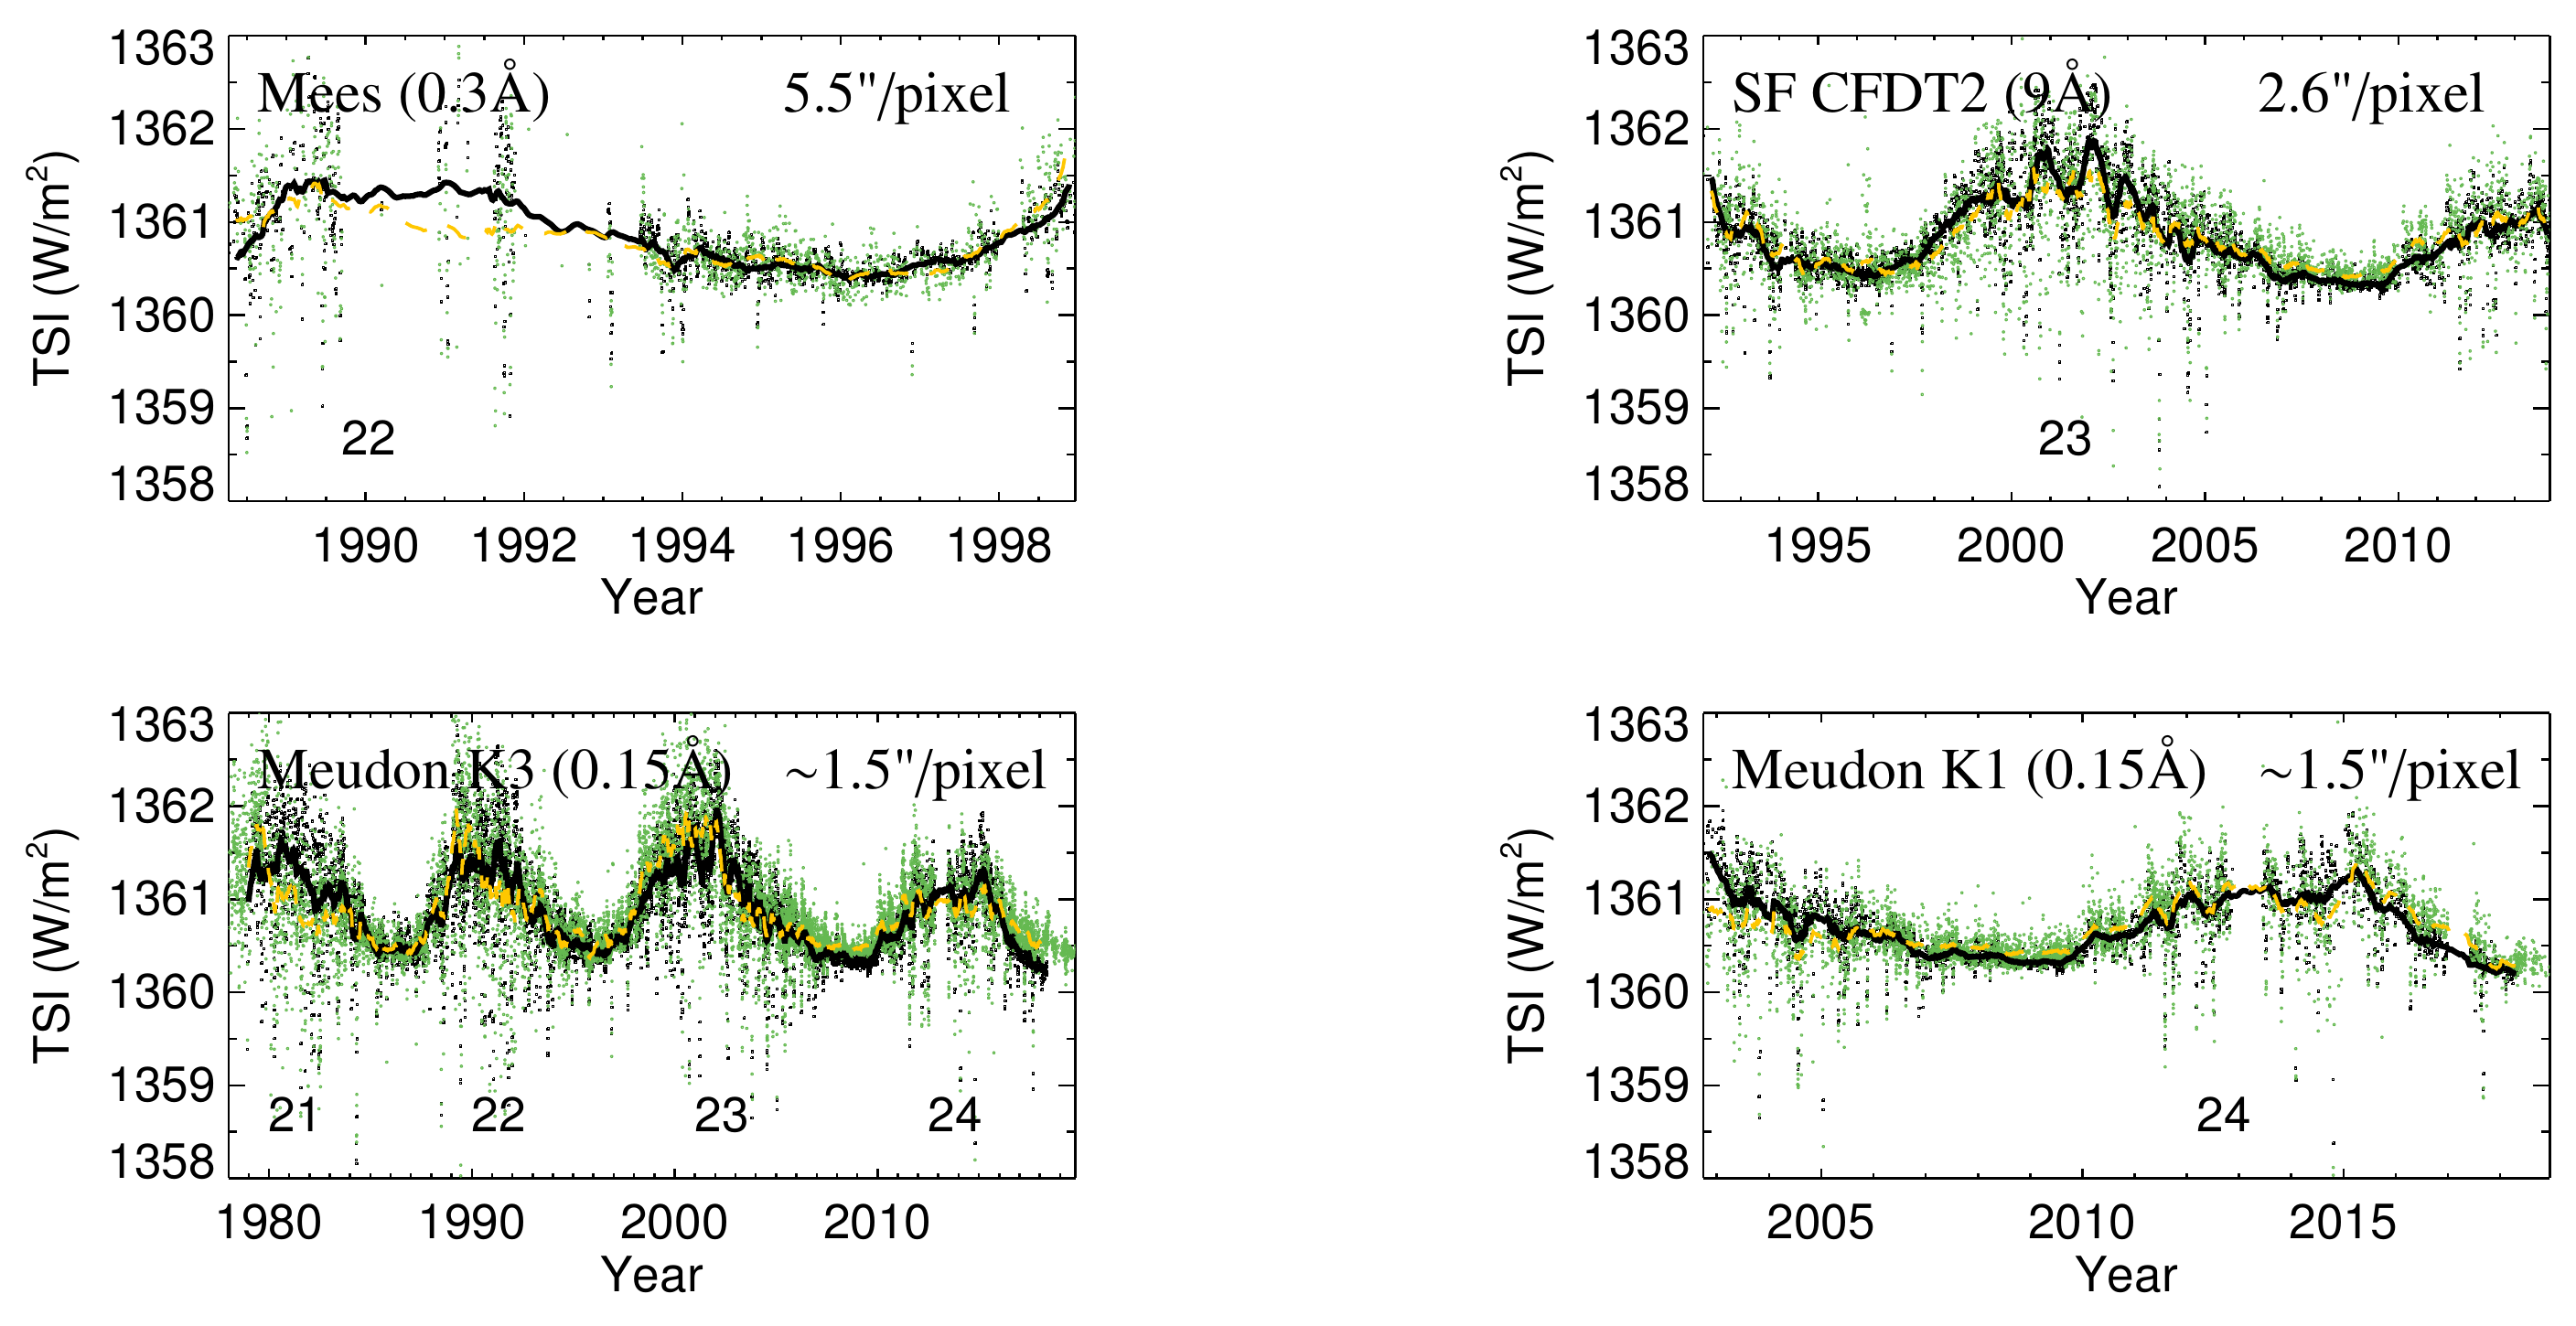
Figure 3. TSI variations reconstructed from Mees, San Fernando (SF) CFDT2, Meudon K3 (centred at the core of the line), and Meudon K1 (centred at the wing at 3936.3Å) Ca II K observations (green for daily and orange for 81-day running mean). Also shown are the values from the PMOD TSI composite (black). The parentheses give the bandwidth used for the observations, while we also provide the pixel scale of the images. This shows good agreement between our reconstructions and the PMOD TSI composite that is relatively insensitive to observational parameters. The numbers in the lower part of each panel denote the solar cycle number and are plotted approximately at times of activity maximum.
Collectively, these efforts enable employing Ca II K observations to reconstruct irradiance variations. We adapted the Spectral and Total Irradiance Reconstructions (SATIRE) model (Krivova et al. 2003) to take the sunspot area record by Mandal et al. (2020) and magnetograms reconstructed from Ca II K images (Chatzistergos et al. 2021) as input instead of directly recorded magnetograms and continuum images. Our resulting TSI reconstruction from Rome/PSPT (Precision Solar Photometric Telescope) Ca II K observations (shown in Figs. 1 and 2) agrees well with the PMOD (named after Physikalisch-Meteorologisches Observatorium Davos, Figs. 2a and b) and RMIB (named after Royal Meteorological Institute of Belgium, Fig. 2c) TSI composites of direct TSI measurements, but not the ACRIM (Active Cavity Radiometer Irradiance Monitor, which is the main instrument used in this series) TSI composite (Fig. 2d). We have also shown that Ca II K observations performed with diverse observational settings (narrow or broad bandwidth, offsets in the central wavelength, low or high pixel scale, taken with a spectroheliograph or a filter, and stored on photographic plates or performed with a CCD camera) can be used to accurately reconstruct irradiance variations (Fig. 3).
Conclusions
Ca II K data are an invaluable source of information for studies of past solar magnetism and irradiance variations. We have compiled, processed, photometrically calibrated (when needed) and analysed the most comprehensive set of Ca II K observations covering the period since 1892 until now. We also show that such data can be used for accurate reconstructions of solar irradiance variations.
This project has received funding from the European Union’s Horizon 2020 Research and Innovation program under grant agreement No 824135 (SOLARNET). This work was supported by the Italian MIUR-PRIN grant 2017 “Circumterrestrial Environment: Impact of Sun–Earth Interaction” (grant 2017APKP7T) and by the German Federal Ministry of Education and Research (Project No. 01LG1909C).
References
Chatzistergos, T., Ermolli, I., Krivova, N. A., Solanki, S. K., et al. 2020, A&A, 639, A88. https://doi.org/10.1051/0004-6361/202037746.
Chatzistergos, T., Ermolli, I., Solanki, S. K., and Krivova, N. A. 2018, A&A, 609, A92. https://doi.org/10.1051/0004-6361/201731511.
Chatzistergos, T., Ermolli, I., Solanki, S. K., Krivova, N. A., et al. 2019, A&A, 626, A114. https://doi.org/10.1051/0004-6361/201935131.
Chatzistergos, T., Krivova, N. A., Ermolli, I., Yeo, K. L., et al. 2021, A&A, 656, A104. https://doi.org/10.1051/0004-6361/202141516.
IPCC, 2021: Climate Change 2021: The Physical Science Basis. Contribution of Working Group I to the Sixth Assessment Report of the Intergovernmental Panel on Climate Change [Masson-Delmotte, V. et al. (eds.)]. Cambridge University Press. In Press.
Kren, A. C., Pilewskie, P., and Coddington, O. 2017, JSWSC, 7, A10. https://doi.org/10.1051/swsc/2017007.
Krivova, N. A., Solanki, S. K., Fligge, M., and Unruh, Y. C. 2003, A&A, 399, L1. https://doi.org/10.1051/0004-6361:20030029.
Mandal, S., Krivova, N. A., Solanki, S. K., Sinha, N. and Banerjee D. 2020, A&A, 640, A78. https://doi.org/10.1051/0004-6361/202037547.
Solanki, S. K., Krivova, N. A. and Haigh, J. D. 2013, ARA&A, 51, 311. https://doi.org/10.1146/annurev-astro-082812-141007.
Yeo, K. L., Solanki, S. K., Norris, C. M., Beeck, B., et al. 2017, Physical Review Letters, 119. https://doi.org/10.1103/PhysRevLett.119.091102.