M. Murabito, I. Ermolli, F. Giorgi (INAF - Osservatorio Astronomico di Roma, Italy)
M. Stangalini (ASI Agenzia Spaziale Italiana, Italy)
J. Shetye, E. Verwichte, T. Arber, T. Goffrey (University of Warwick, UK)
Chromospheric rotating structures, named differently over time (e.g. vortices, tornadoes or swirls), have been observed in the Sun’s atmosphere for many years. They are believed to channel energy between different layers of the solar atmosphere. Former observations and numerical simulations [1] suggest that these structures are magnetic in nature. Chromospheric measurements acquired in the infrared Ca II 854.2 nm line with the Interferometric BIdimensional Spectrometer (IBIS) at the Dunn Solar Telescope (DST) reveal, for the first time, circular and linear polarization signals in two rotating structures. These observations allow us to determine the line-of-sight and horizontal component of the magnetic field in the two observed vortices.
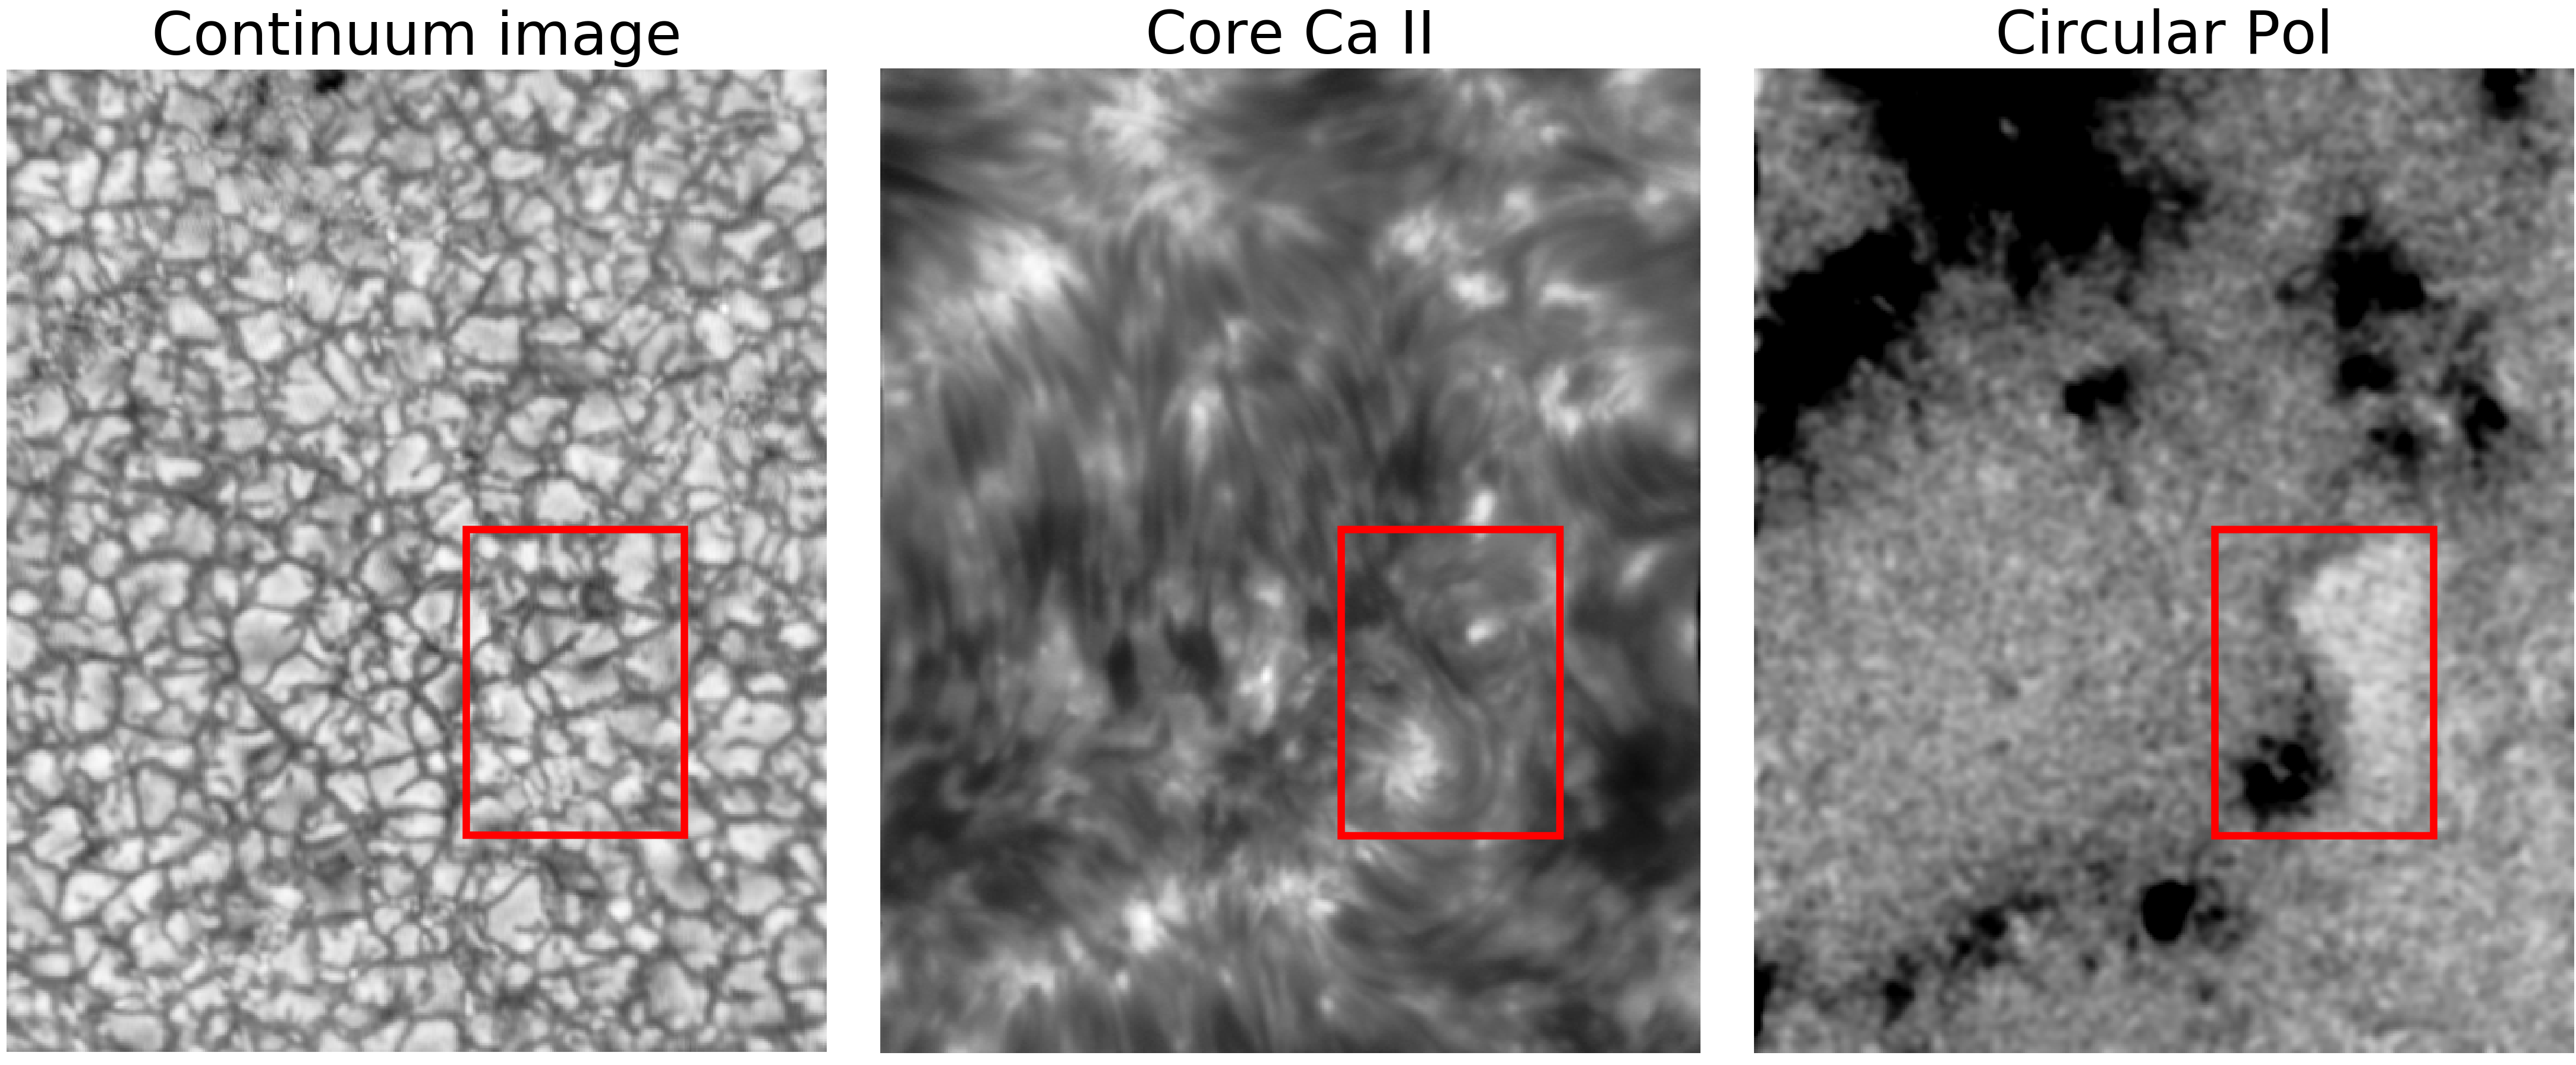
Figure 1. Images showing a zoom of the IBIS observations. From left to right: map of the continuum intensity at 633.3 nm, chromospheric line core intensity and chromospheric circular polarization derived from Ca II 854.2 nm line measurements. The red boxes indicate the sub-FOV where the vortices are observed.
The IBIS instrument closely observed two rotating structures in a quiet Sun region for about an hour with excellent seeing. The IBIS field of view encompasses a large area of magnetic network (around 25” x 64”). At the border of a network cell, the two vortices are captured in the Ca II line core. The perfect conditions and the acquisition of spectropolarimetric measurements sampling the solar atmosphere from the photosphere to the upper chromosphere allow us to confirm the magnetic nature of both the observed vortices. They consist of small-scale bright and dark patches forming a pattern of spiral arms and concentric rings [2] (see top panels of Figure 2) showing clockwise rotation during the entire observation period. Observations in the middle-upper photosphere sampled by the Ca line wing (see middle panels) display small brightening events (indicated by the yellow arrows). The circular and linear polarization (hereafter, CP and LP) signals detected in the vortices represent the first direct observation of their magnetic nature. In particular, the chromospheric CP maps (see the bottom panels in Figure 2) display a compact negative patch (with values larger than 0.5% and up to 1.5%) that is co-spatial with the northern vortex and a more diffused opposite-polarity patch (with values up to 0.9%) at the southern one.
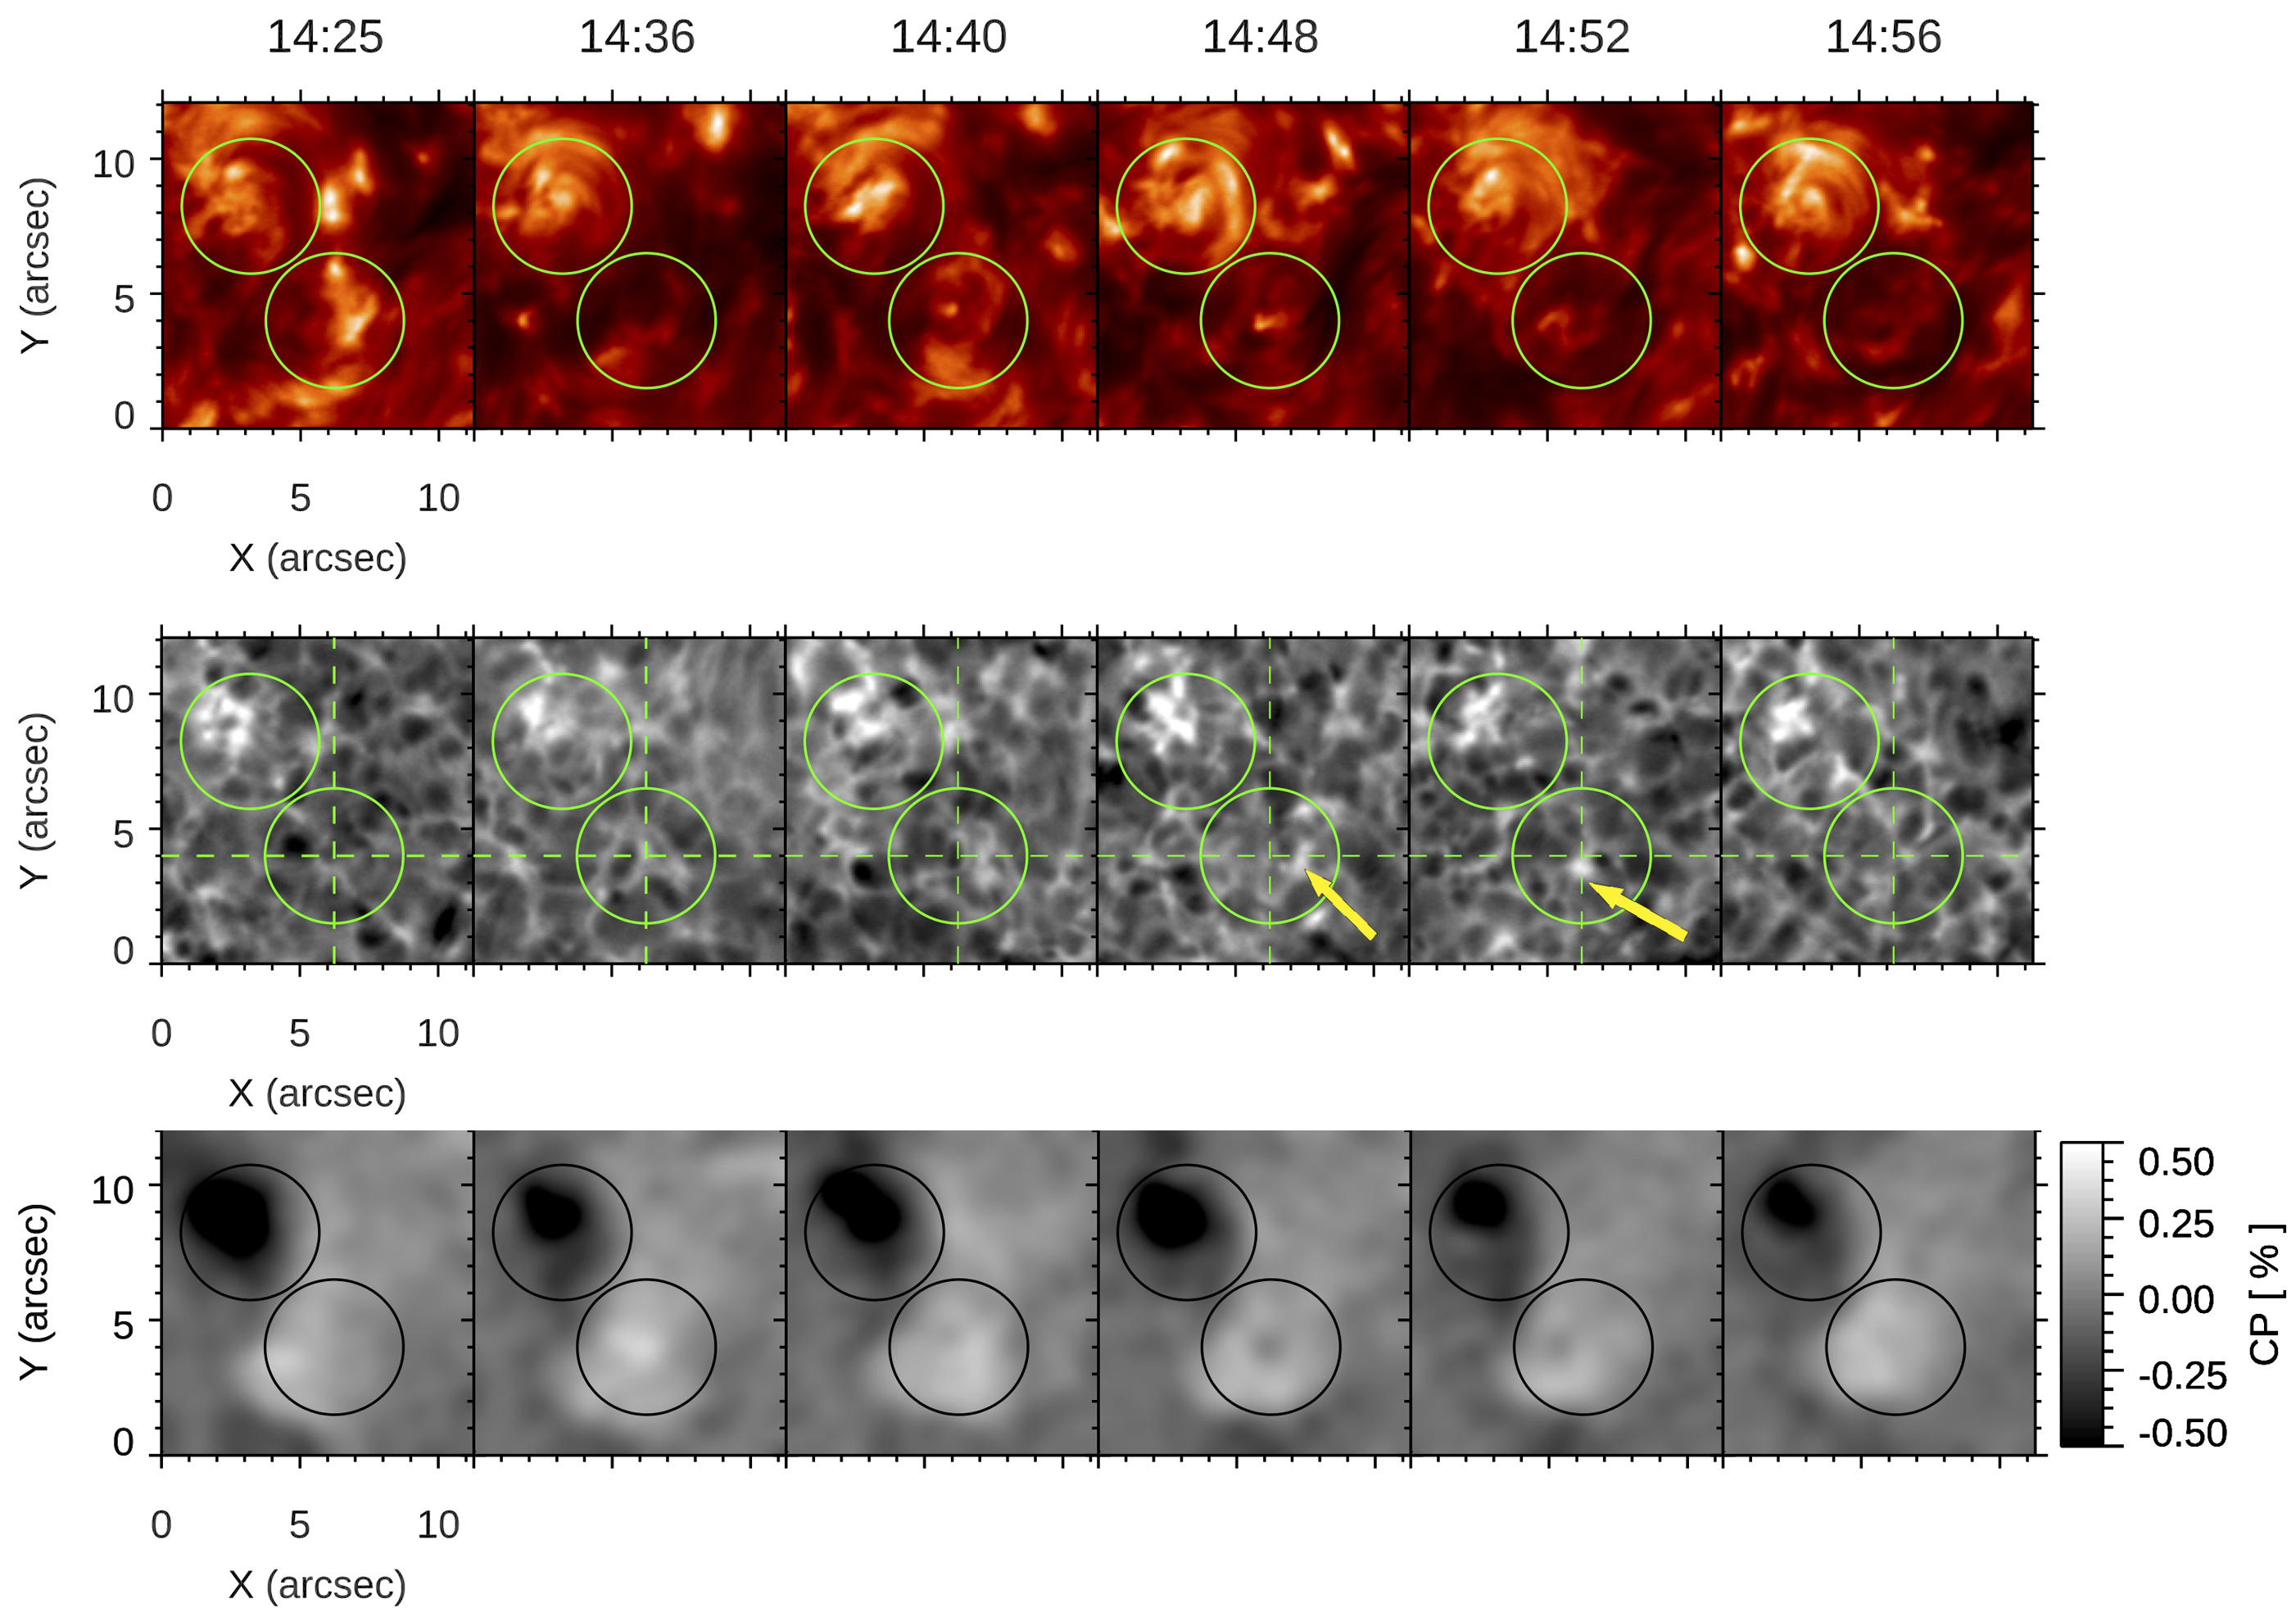
Figure 2. Maps of the Ca II 854.2 nm line core intensity (top panels), line wing intensity (middle panels) and circular polarization (bottom panels) in the sub-FOV shown in Figure 1. The circles locate the two vortices. Yellow arrows point to small-scale brightening (see text for more details).
The polarization signals from these structures are very weak, in particular those coming from the measurements of Stokes Q and U. However, since they are visible during the entire time interval of the IBIS observation, this makes it possible to average the polarization signal over time and create time-averaged CP, LP and LOS velocity maps (see Figures 3 and 4). The CP and LP maps are derived from the Stokes V, Q, and U profile measurements, respectively. By summing the Stokes V signal we obtain the CP map, while the sum of the Stokes Q and U signals provides the LP maps (see [3] for details on how these maps are calculated). This approach permits us to extract meaningful information from the very weak Stokes Q and U measurements and obtain a map with values well above the noise level for these kinds of measurements (see middle panel of Figure 3). This measurement shows the horizontal component of the magnetic field in and around the studied vortices. Figure 4 displays the chromospheric LOS velocity map, overplotted with the chromospheric horizontal flow vectors. This map shows a net clockwise horizontal rotation pattern in both observed structures. In particular, the rotation of the southern vortex is much clearer and faster than the northern one.
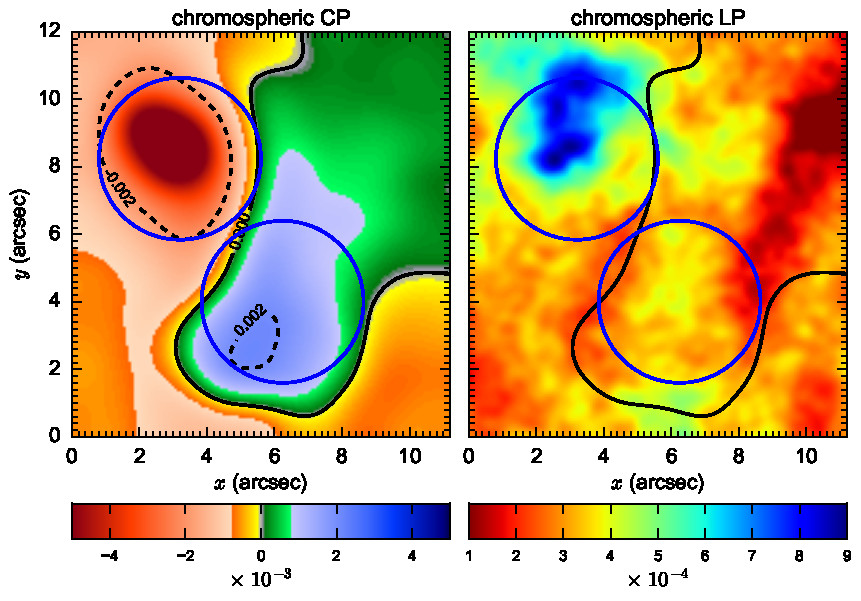
Figure 3. Maps of the chromospheric circular and linear polarization (CP and LP) averaged in time. The blue circles indicate the two vortices, and black contours represent the polarity inversion line.
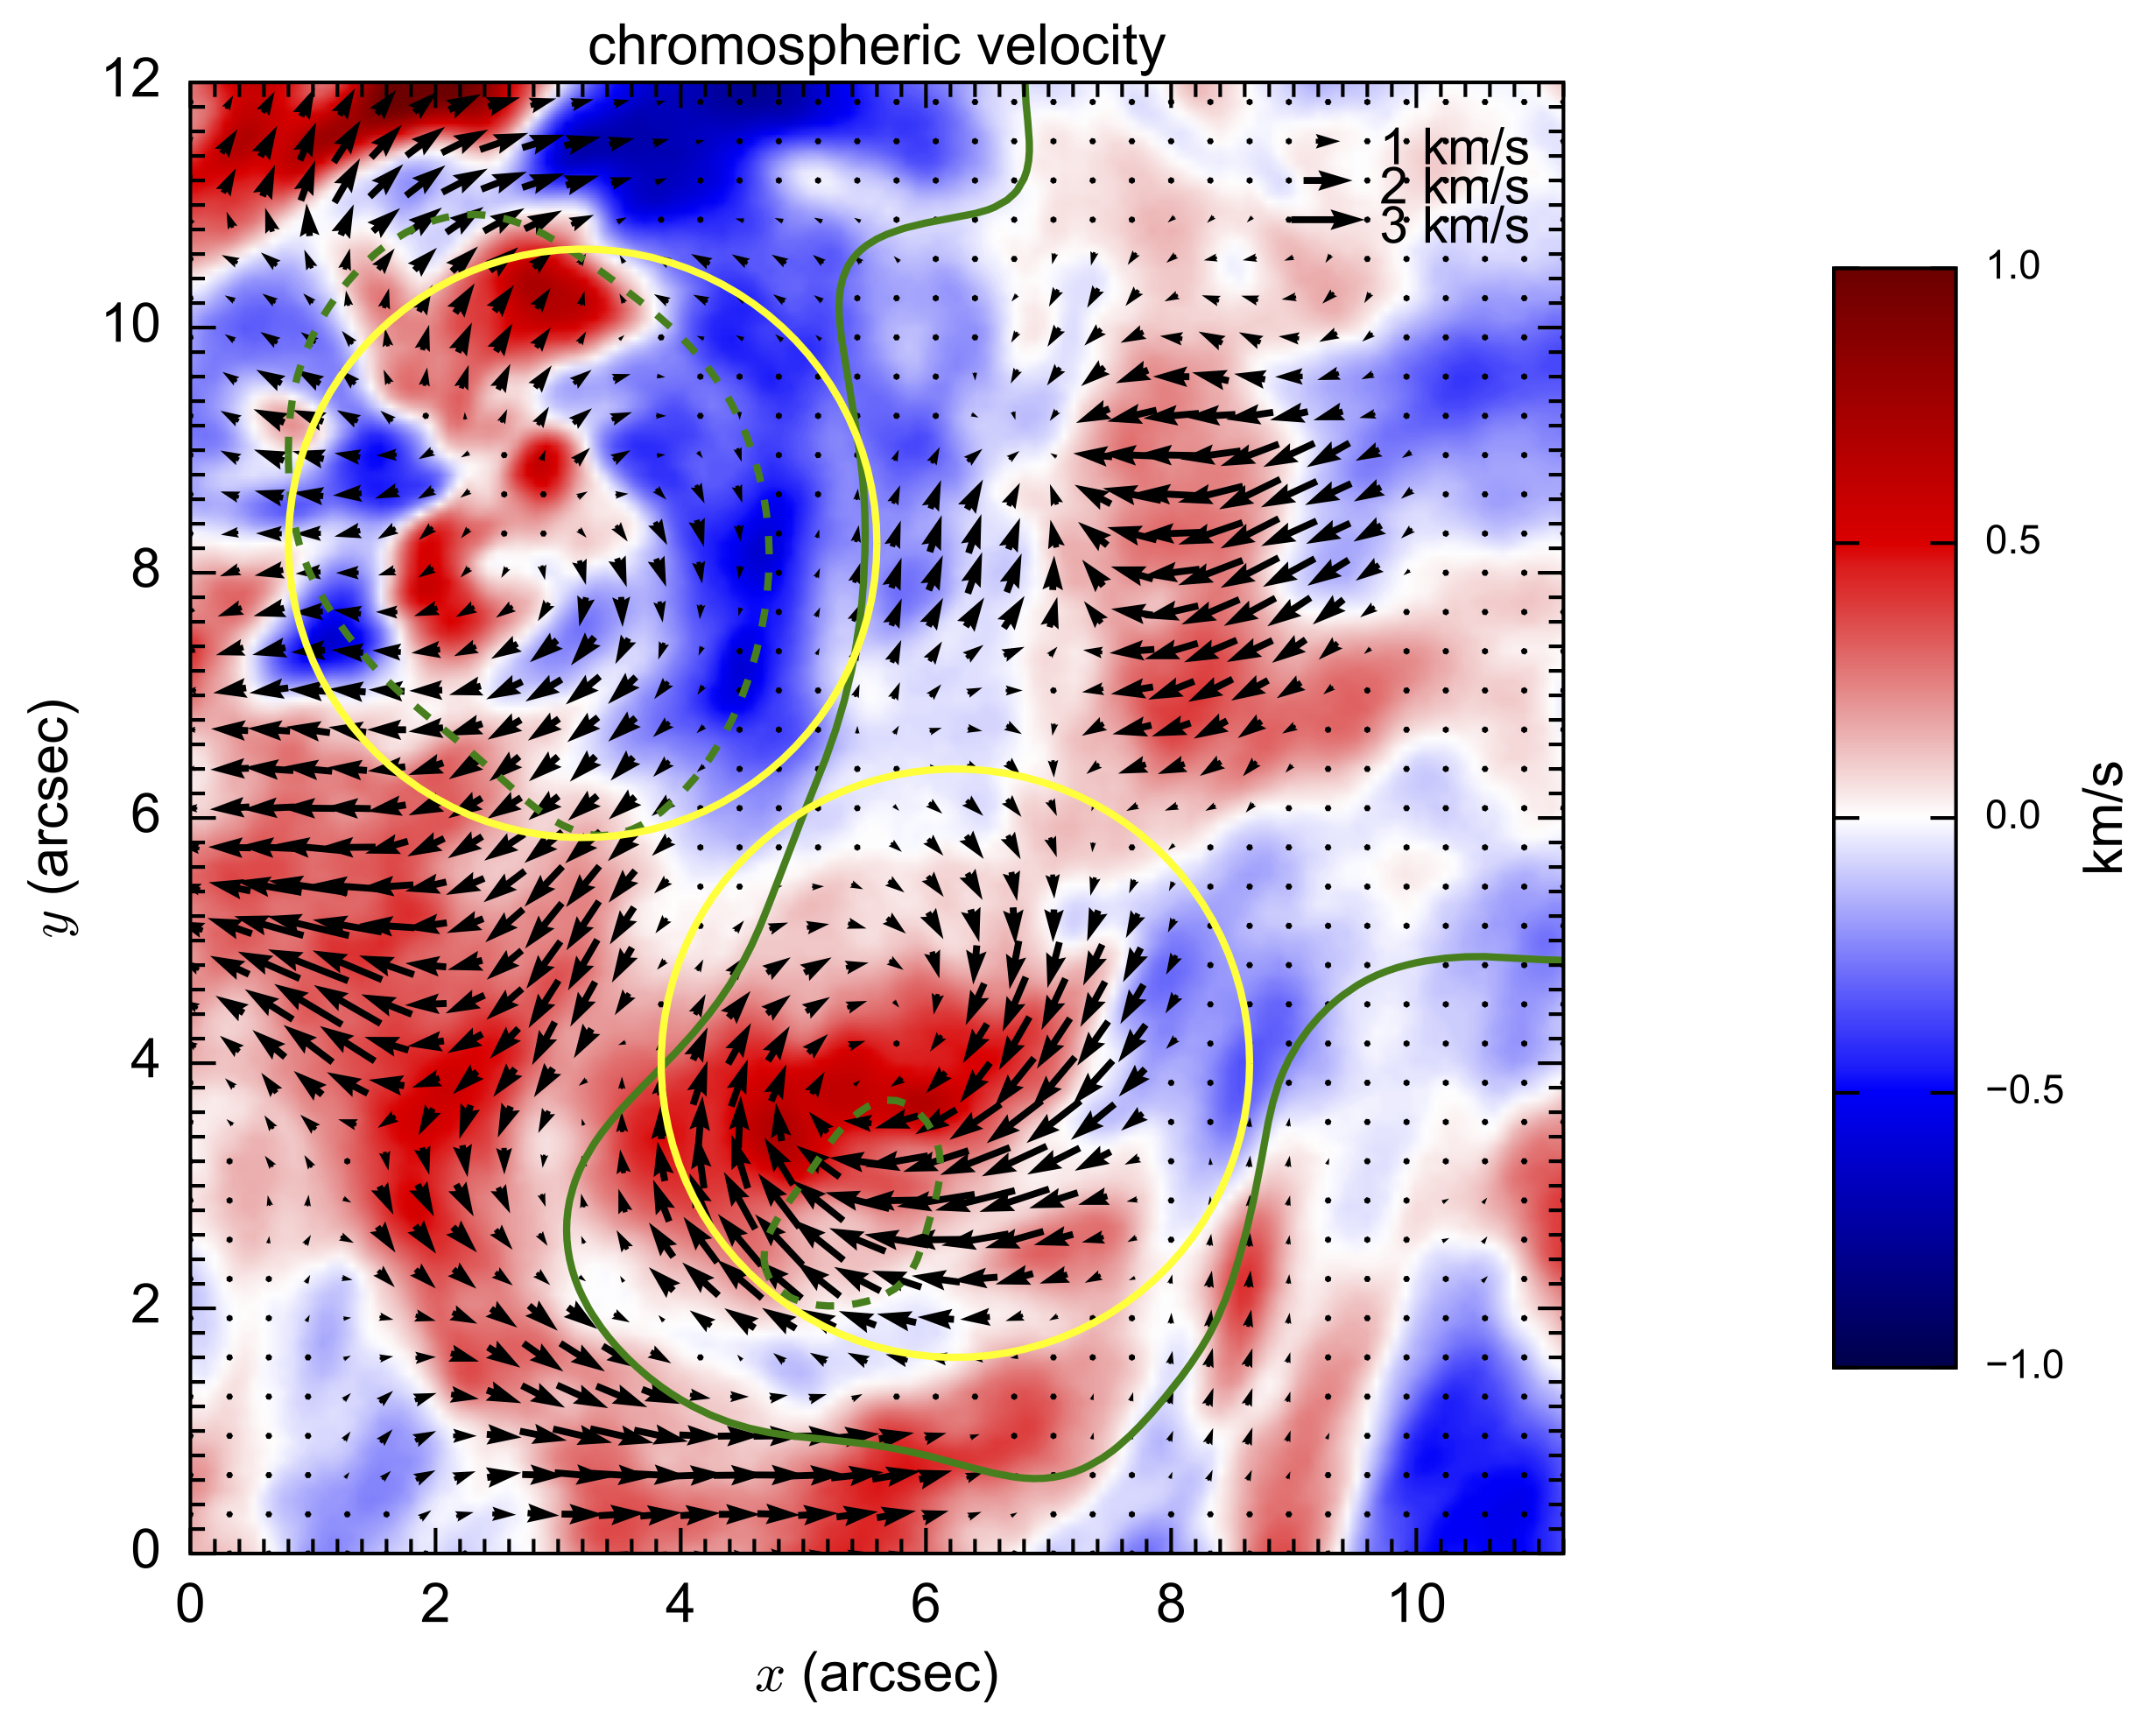
Figure 4. Map of the line-of-sight velocity averaged in time. The yellow circles indicate the two vortices, and green contours represent the polarity inversion line. The arrows show the horizontal flow field.
Conclusions
We have reported the first direct detection of the magnetic field in two quiet-Sun chromospheric vortices. Our observations reveal a clear pattern of circular polarisation signal in and around these two structures across the whole observational period lasting about an hour. The combined estimation of circular and linear polarisation patterns provides insight into the LOS and horizontal components of the magnetic field at chromospheric heights, never observed before.
Chromospheric spectropolarimetric measurements are essential for a better understanding of the physics behind these rotating structures. Multi-wavelength observations at high spatial resolution have already been performed over the past two decades by using present spectropolarimeters (such as the ground-based IBIS and CRISP and the space-borne Hinode/SP instruments) allowing us to unveil many small-scale dynamic features in the Sun’s atmosphere reaching a spatial resolution of 90-120 km and a polarimetry accuracy of the order of 10-3. However, the highest possible spatial resolution and a minimum polarimetric sensitivity of the order of 10-5 simultaneously in 5 or more spectral lines is the main goal of the future four-metre class solar telescopes. This will enable us to study these structures across the Sun’s atmosphere with unprecedented spatial resolution and polarimetric sensitivity.
This work has been published in
Murabito, M., Shetye, J., Stangalini, M., Verwichte, E., Arber, T., Ermolli, I., Fiorgi, F., & Goffrey, T. 2020, A&A, 639, A59
References
[1] Wedemeyer-Böhm, S., Scullion, E., Steiner, O., et al. 2012, Nature, 486, 505
[2] Wedemeyer-Böhm, S., & Rouppe van der Voort, L. 2009, A&A, 507, L9
[3] Murabito, M., Shetye, J., Stangalini, et al. 2020, A&A, 639, A59
Acknowledgements
This research has received funding from the European Union’s Horizon 2020 research and innovation programme under Grant Agreement No 824135 (SOLARNET), the Istituto Nazionale di Astrofisica (INAF) and the Italian MIUR-PRIN grant 2017 “Circumterrestrial Environment: Impact of Sun–Earth Interaction”. The authors wish to acknowledge scientific discussions with the Waves in the Lower Solar Atmosphere (WaLSA; www.WaLSA.team) team. This research has made use of the IBIS-A archive.