C. E. Fischer, G. Vigeesh, P. Lindner, J.M. Borrero (Leibniz Institute for Solar Physics, Freiburg, Germany)
F. Calvo (Institute for Solar Physics, Stockholm University, Stockholm, Sweden)
O. Steiner (Istituto Ricerche Solari Locarno, Locarno-Monti, Switzerland)
The Sun shows a distinct granulation pattern in visible light, caused by convection cells in which hot gas rises up to the solar surface within the granules and returns back into the Sun within narrow dark lanes separating the granules (intergranular lanes). This constant “boiling” on a time scale of minutes can be easily observed in time-series recordings of the continuous radiation. The granules appear as bright extended features and the intergranular lanes as contiguous dark narrow lanes in between (see Figure 1a of a simulation). A large number of granules exhibit another distinct feature - the so-called granular lanes (GLs). This feature presents as a bright rim followed by a dark archlike lane traveling into the host granule (see arrow pointing to a GL that has just been launched in Figure 1a). It then either disappears within the granule, or retracts back to the granule boundary from where it had started from.
With the help of 3-D magnetohydrodynamic simulations it was found that this intensity pattern is the visible signature of a subsurface velocity vortex tube (Steiner et al., 2010). Figure 1a shows a synthesised continuum image with granules hosting granular lanes. In Figure 1b a cross section of the solar atmosphere and the subsurface is shown. The thick white middle contour in the lower panel represents the solar surface as is observed in visible light. The velocity arrows show a vortex, with its axis piercing through the viewing plane at around (y,z) = (4.3, -0.15) Mm. The top panel shows the bright and dark intensity features which are observed at the surface along the black vertical line indicated in Figure 1a.
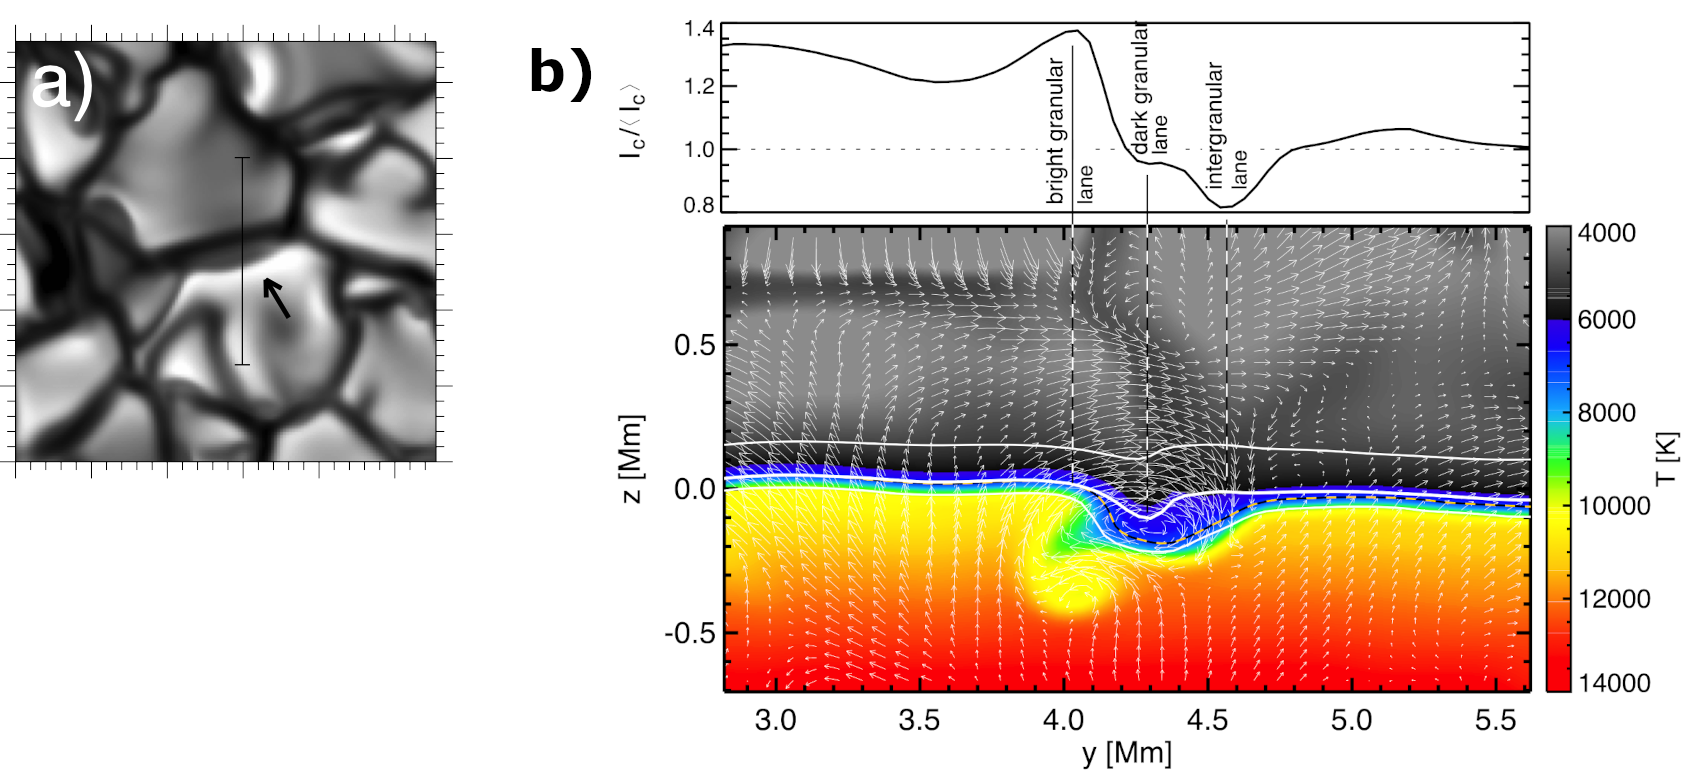
Figure 1. (a) Example of a granular lane as seen in a synthesised image of the continuous radiation (5.3 Mm x 5.3 Mm). The arrow points to one of the granular lanes. (b) Vertical cross section through the computational domain along the black vertical line shown in panel a. The top panel shows the emergent synthesised continuum intensity and the bottom one shows the vertical cross section. Colors indicate temperature and arrows the velocity field. The white contours indicate optical depths of τ = 0.1, 1.0, and 10 from top to bottom. The longest arrows correspond to a velocity of 8.5 km s-1. The vortex-tube axis is located at (y, z) = (4.3, -0.15) Mm. (Adapted from Steiner et al., 2010)
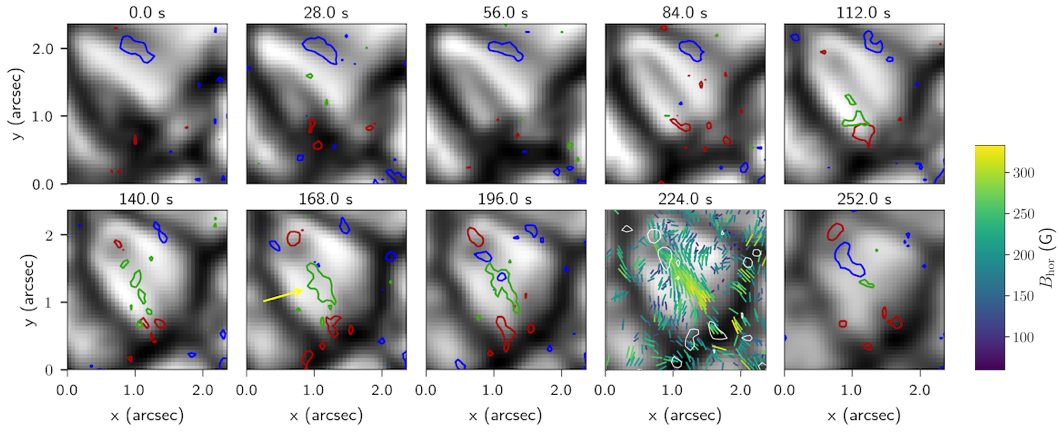
Figure 2. The sequence of maps shows the continuum intensity close to the Fe I 617.3 nm line. Contours in red and blue mark positive and negative circular polarisation whereas green contours denote linear polarisation. The yellow arrow points to the location where the dark component of the granular lane is occupied by a substantial patch of linear polarization. The panel at t = 224 s indicates the direction of the horizontal magnetic field as calculated through Stokes inversions. Adapted from Fischer et al. (2020).
We were recently able to capture a faint signal of elongated linear polarisation patches at the locations of the GLs (Fischer et al., 2020). This was possible by using one of the European solar telescopes for high-resolution observations, the Swedish 1-m Solar Telescope (Scharmer et al., 2003), which we obtained access to through the SOLARNET program, for recording several hours of excellent data. The continuum time series in Figure 2 shows the archlike structure of a granular lane traveling diagonally from left to right into the granule. The linear polarisation indicates a horizontal magnetic field and is found to be in all studied cases flanked by circular polarisation indicating vertical magnetic field. Analysis of the polarisation signal employing Stokes inversions methods allowed us to infer the direction of the horizontal magnetic field proving that the detected horizontal magnetic field is aligned with the dark lane of the GL.
The appearance of magnetic field in connection with granular lanes, which are the signatures of vortex tubes, led us to investigate where these fields come from and how they emerge. By studying simulations performed with the CO5BOLD code (Freytag et al., 2013), we showed that vortex tubes can drag magnetic field from intergranular lanes into granule interiors and let them re-emerge into the solar atmosphere. The magnetic field showed several components (lane-aligned, twisted, or turbulent fields) dominating in different stages of the process and revealing a complex magnetic structure. Figure 3 shows the time instant of a simulation containing a vortex tube, which interacts with the magnetic field. The synthesised observable intensity displayed in the bottom shows a GL within the granule in the front, running perpendicularly across the yellow straight line. It harbours two islands of linear polarisation (green contours). By studying the time evolution, we found that this magnetic field was originally located at the intergranular lane and redistributed by the vortex tube. This process of “shallow recirculation” is thought to be an important component of the small-scale dynamo acting at the solar surface.
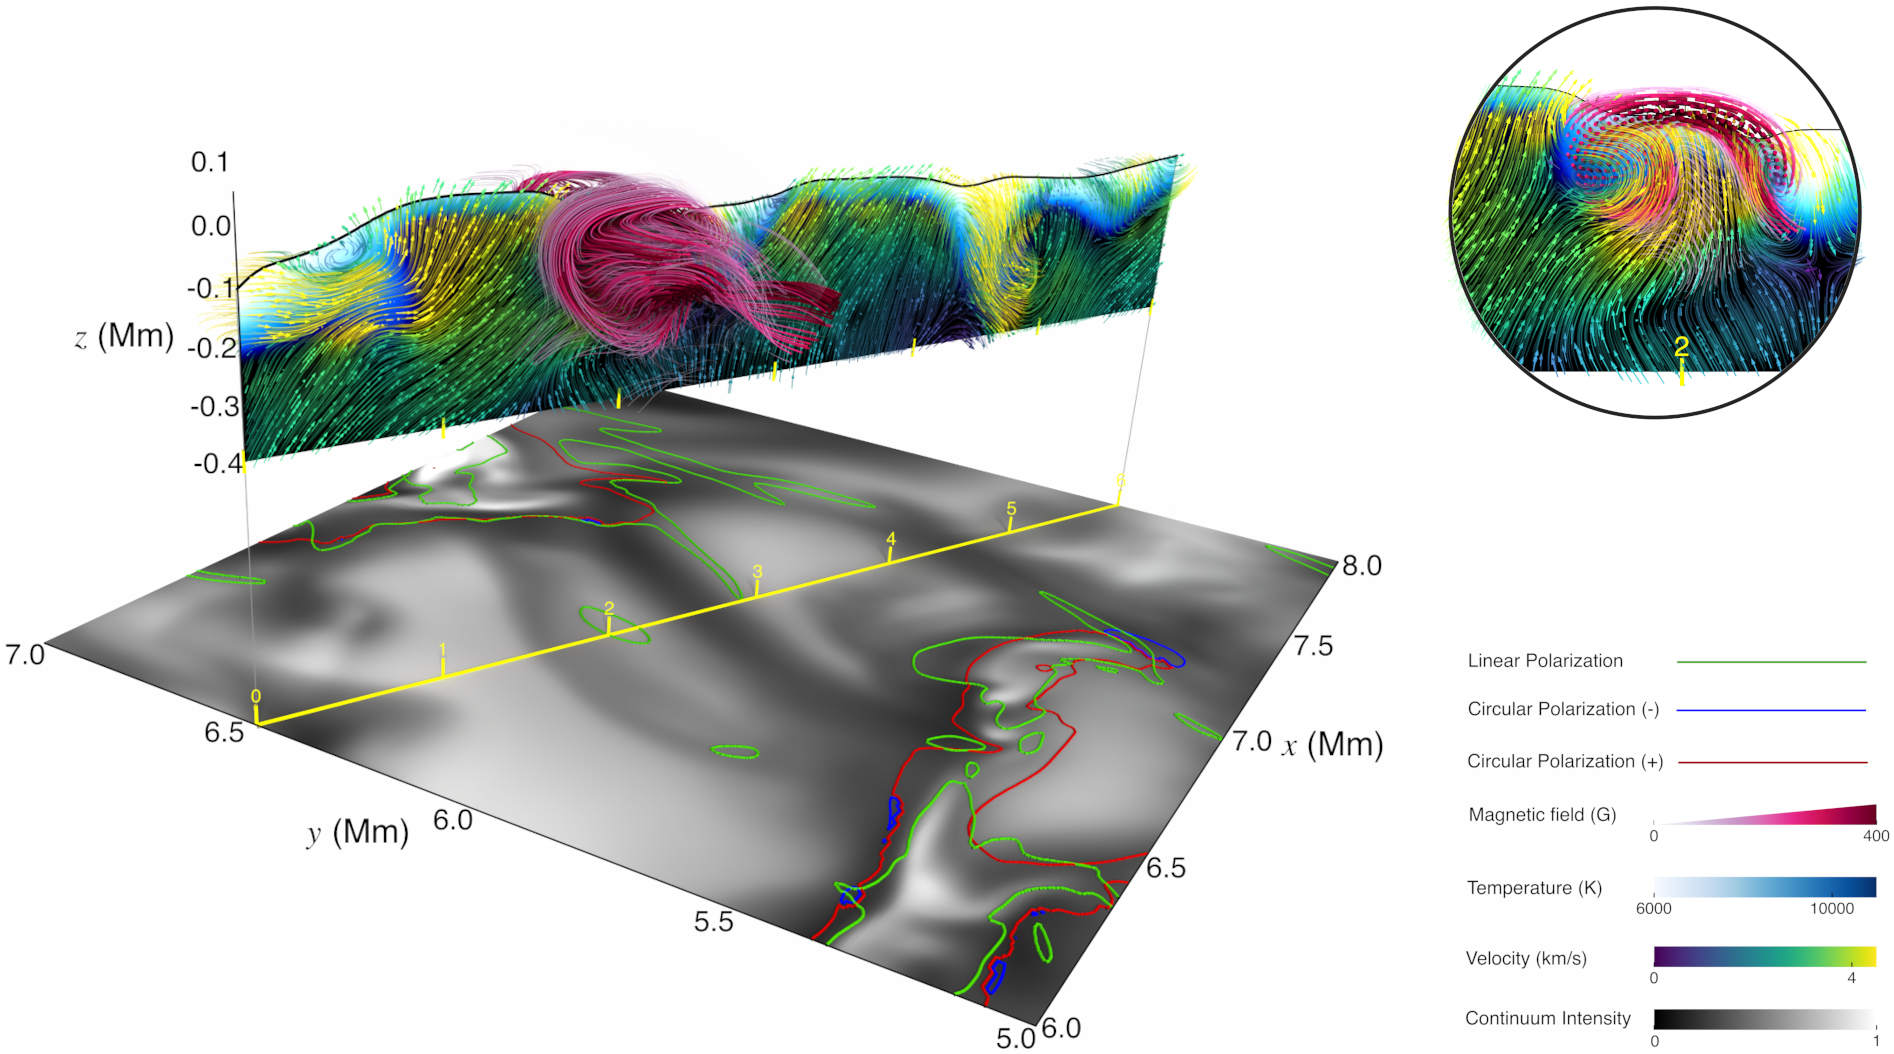
Figure 3. The grayscale panel shows the synthesised continuum intensity. The contours in green outline the linear polarisation calculated from the synthesised Stokes profiles. The circular polarisation is marked by red and blue contours. The 3D scene above displays the temperature and the flow field below the Rosseland optical depth τR = 1 (black curve). The magnetic field lines that cross the section plane are shown in pink color. The circular close-up view provides a clear look at the temperature, flow field, and magnetic field orientation at the location of the granular lane. (Figure from Fischer et al. 2020. The visualisation was done with ParaView.)
Conclusion
We detected horizontal magnetic field at locations of granular lanes, which are the signature of velocity vortex tubes. Simulations show how magnetic fields are trapped within horizontal vortex tubes which twist the fields and transport them into the granules where they emerge and are seen as horizontal magnetic field aligned with the granular lanes. Our observations are the first indications of such a “shallow recirculation” process taking place on the Sun.
Encouraged by these results, we are confident that future observations at very high spatial resolution and high polarimetric sensitivity will permit us a first glance at the operation of the small-scale dynamo.
References
Fischer, C. E., Vigeesh, G., Lindner, P., Borrero, J. M., Calvo, F., & Steiner, O. 2020, ApJ, 903, L10
Freytag, B., Steffen, M., Ludwig, H. G., et al. 2012, JCoPh, 231, 919
Scharmer, G. B., Bjelksjo, K., Korhonen, T. K., Lindberg, B., & Petterson, B. 2003, Proc. SPIE, 4853, 341
Steiner, O., Franz, M., Bello González, N., et al. 2010, ApJL, 723, L180
This project has received funding from the European Union’s Horizon 2020 research and innovation programme under grant agreement No 824135, the Trans-National Access Programme of SOLARNET.