The methodology and results of local seeing estimations for EST are presented.

Figure 1. Temperature (in degrees C) at EST and the surroundings for an observing day in summer.
The European Solar Telescope aims to deliver observations of the highest optical quality under several environmental conditions. One of the main effects degrading the image quality of any ground-based telescope is seeing. This is a consequence of the turbulent Earth atmosphere, which produces random changes in the refractive index of the air. Observatories and telescopes use seeing to characterise their site in terms of optical performance. The image degradation that seeing can introduce on a telescope may be decomposed in two main sources: atmospheric and local seeing. Here the term ‘local seeing’ refers to the contribution of EST itself to the seeing. The geometrical distribution of the different parts of the building and telescope and their thermal behaviour have a clear influence on the seeing. This contribution cannot be measured experimentally until the telescope is built. However, computational methods may be used to estimate these numbers and asses design decisions before construction.
The EST-PO has implemented a multi-physics approach combining thermal, computational fluid dynamics (CFD), and optical analyses to evaluate the local seeing. Every step of this workflow has a specific contribution: the thermal model calculates surface temperatures, which feed the CFD analysis to calculate the air temperature and the refractive index inside the telescope. The optical analysis uses the air refractive index within the telescope's optical path to compute the contributions to image degradation with respect to a perfect telescope.
The transient thermal analysis runs for a full day of observation considering the predominant wind directions at the site and the median wind speed. This model considers the nearby William Herschel Telescope and the Swedish Solar Telescope and the observatory topography in a radius of 300 metres. Figure 1 shows the surface temperatures resulting from this analysis.
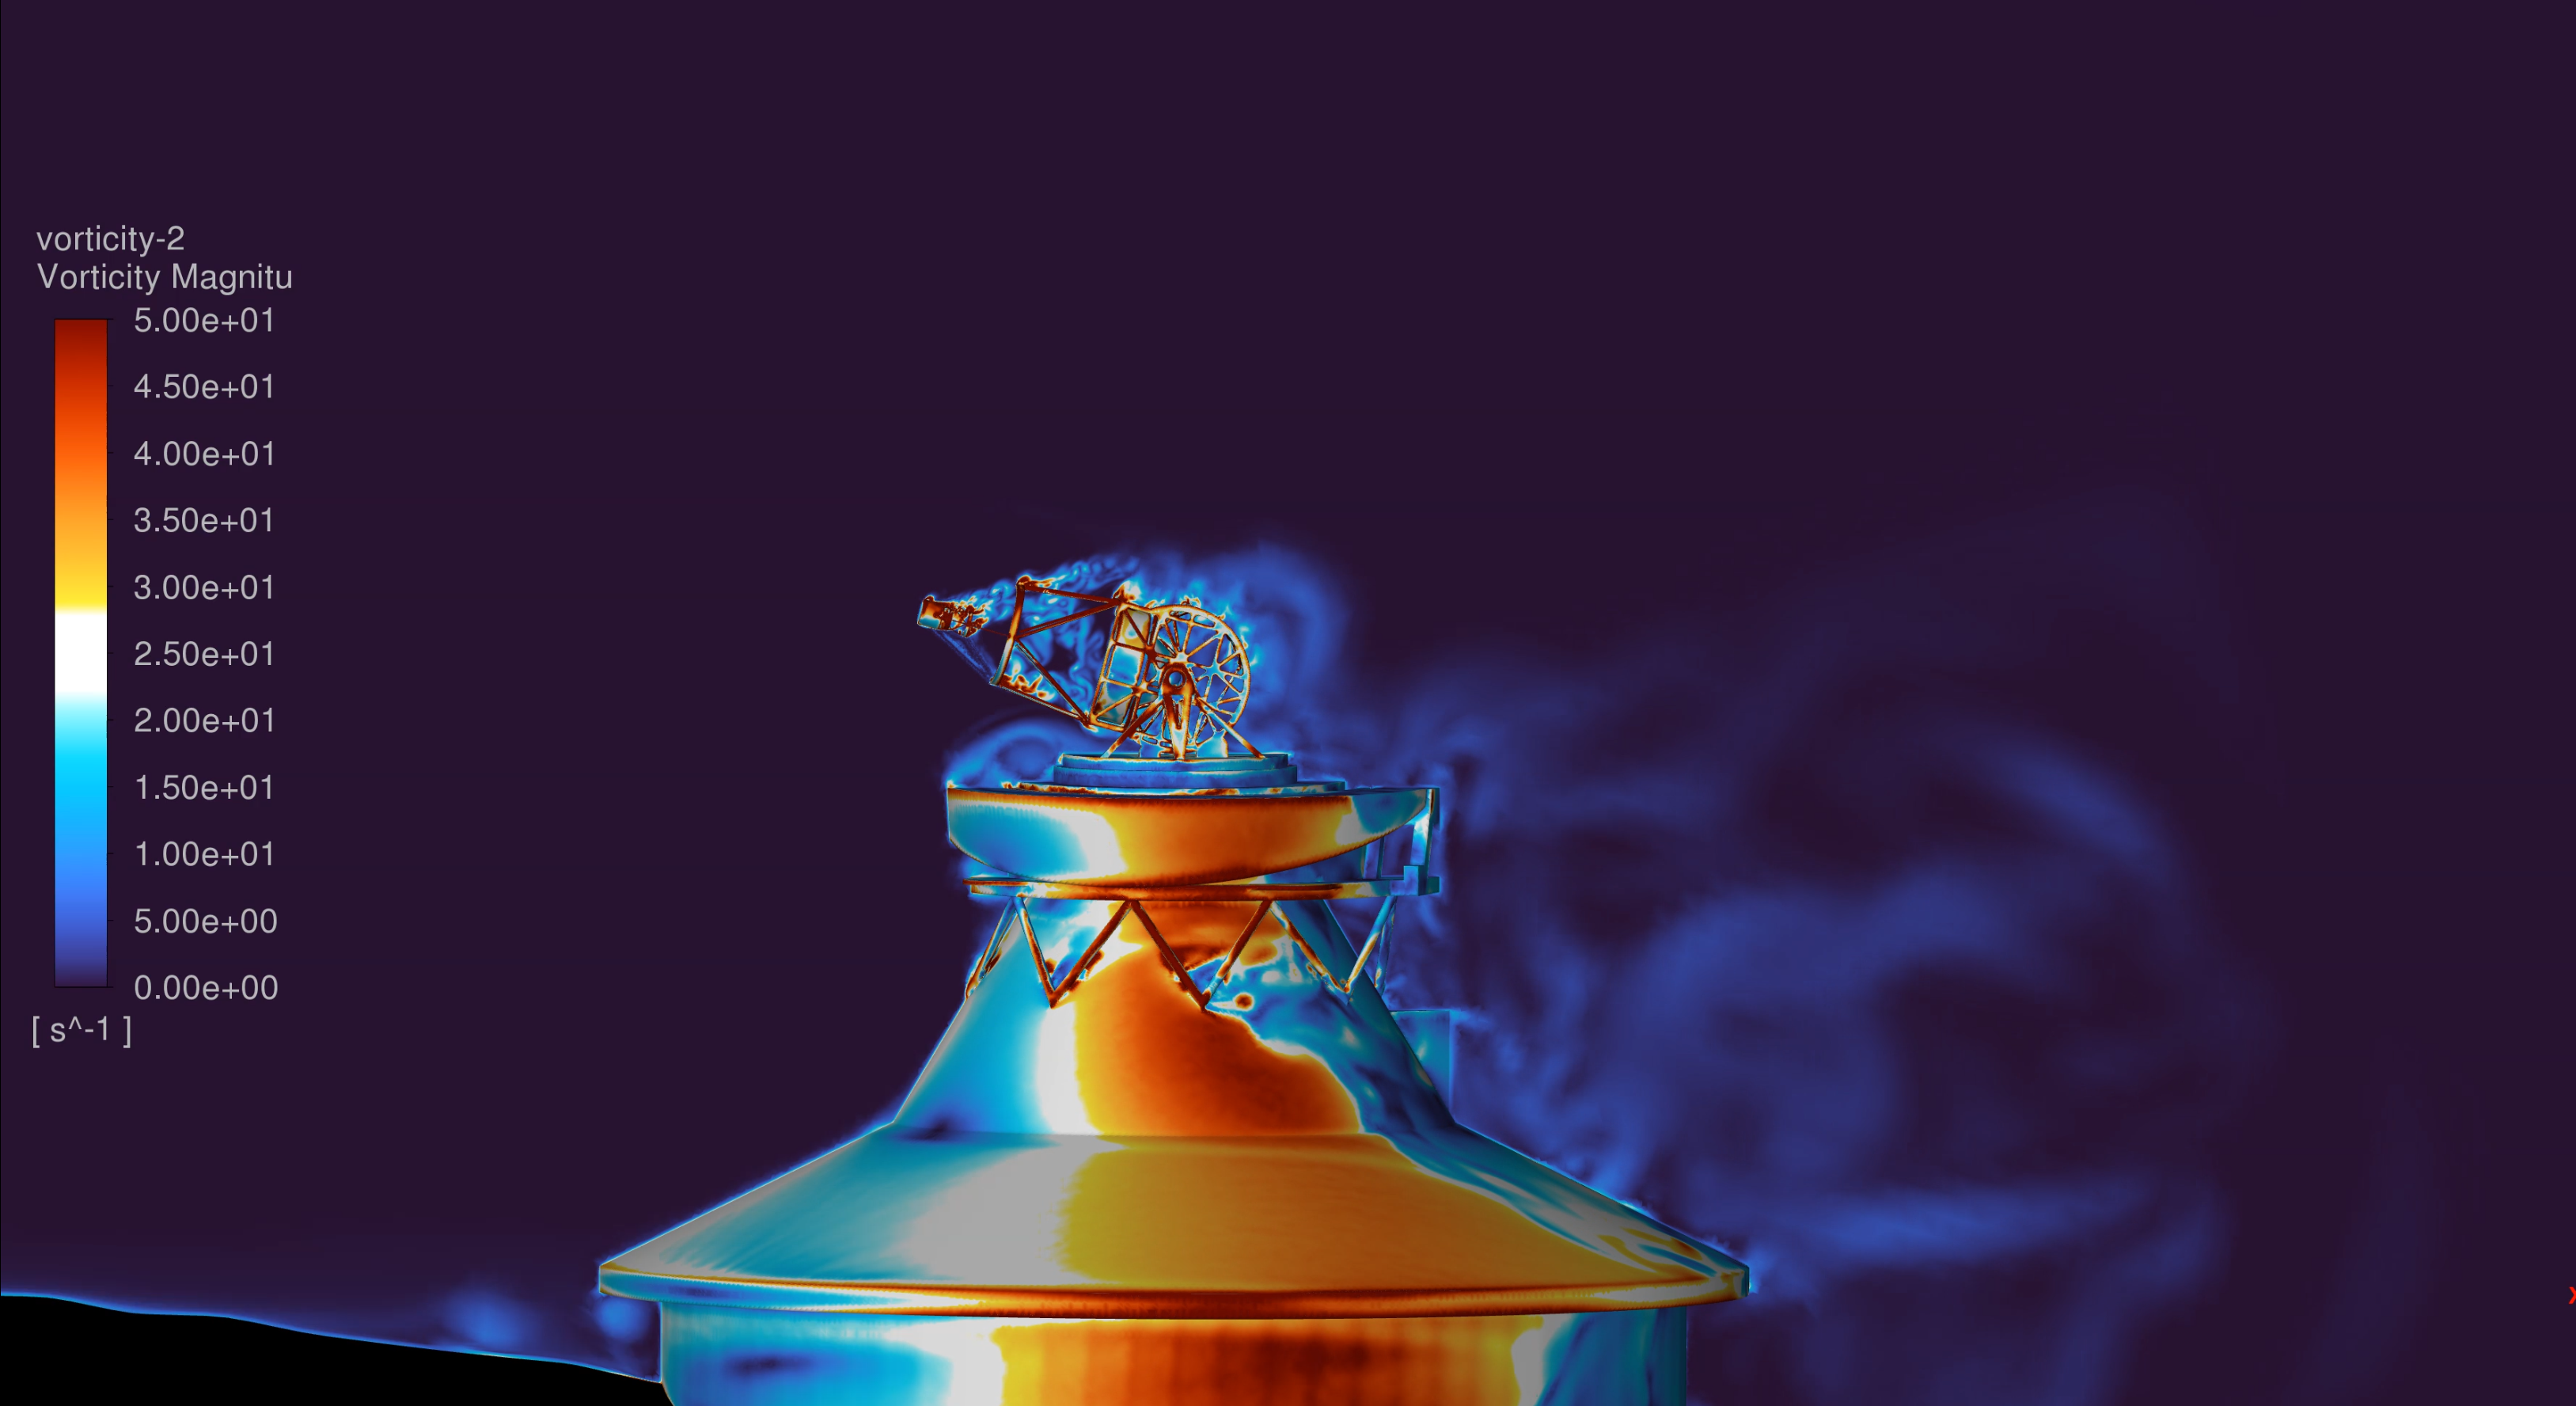
CFD analyses are transient but on a different time scale, as local seeing effects are evaluated on instantaneous time steps. However, a sufficient virtual time of simulation is used to gather data and obtain statistical data that represent the overall behaviour. These analyses use a fixed configuration of temperature and telescope orientation according to thermal analysis. The CFD model uses a larger computational domain of 1 km, as the aerodynamics at the telescopes depend on the topography. Figure 2 shows a snapshot of the vorticity –an indicator of mechanical turbulence– in a vertical plane aligned with the telescope.
 Figure 2. Vorticity in a vertical plane containing the telescope optical axis.
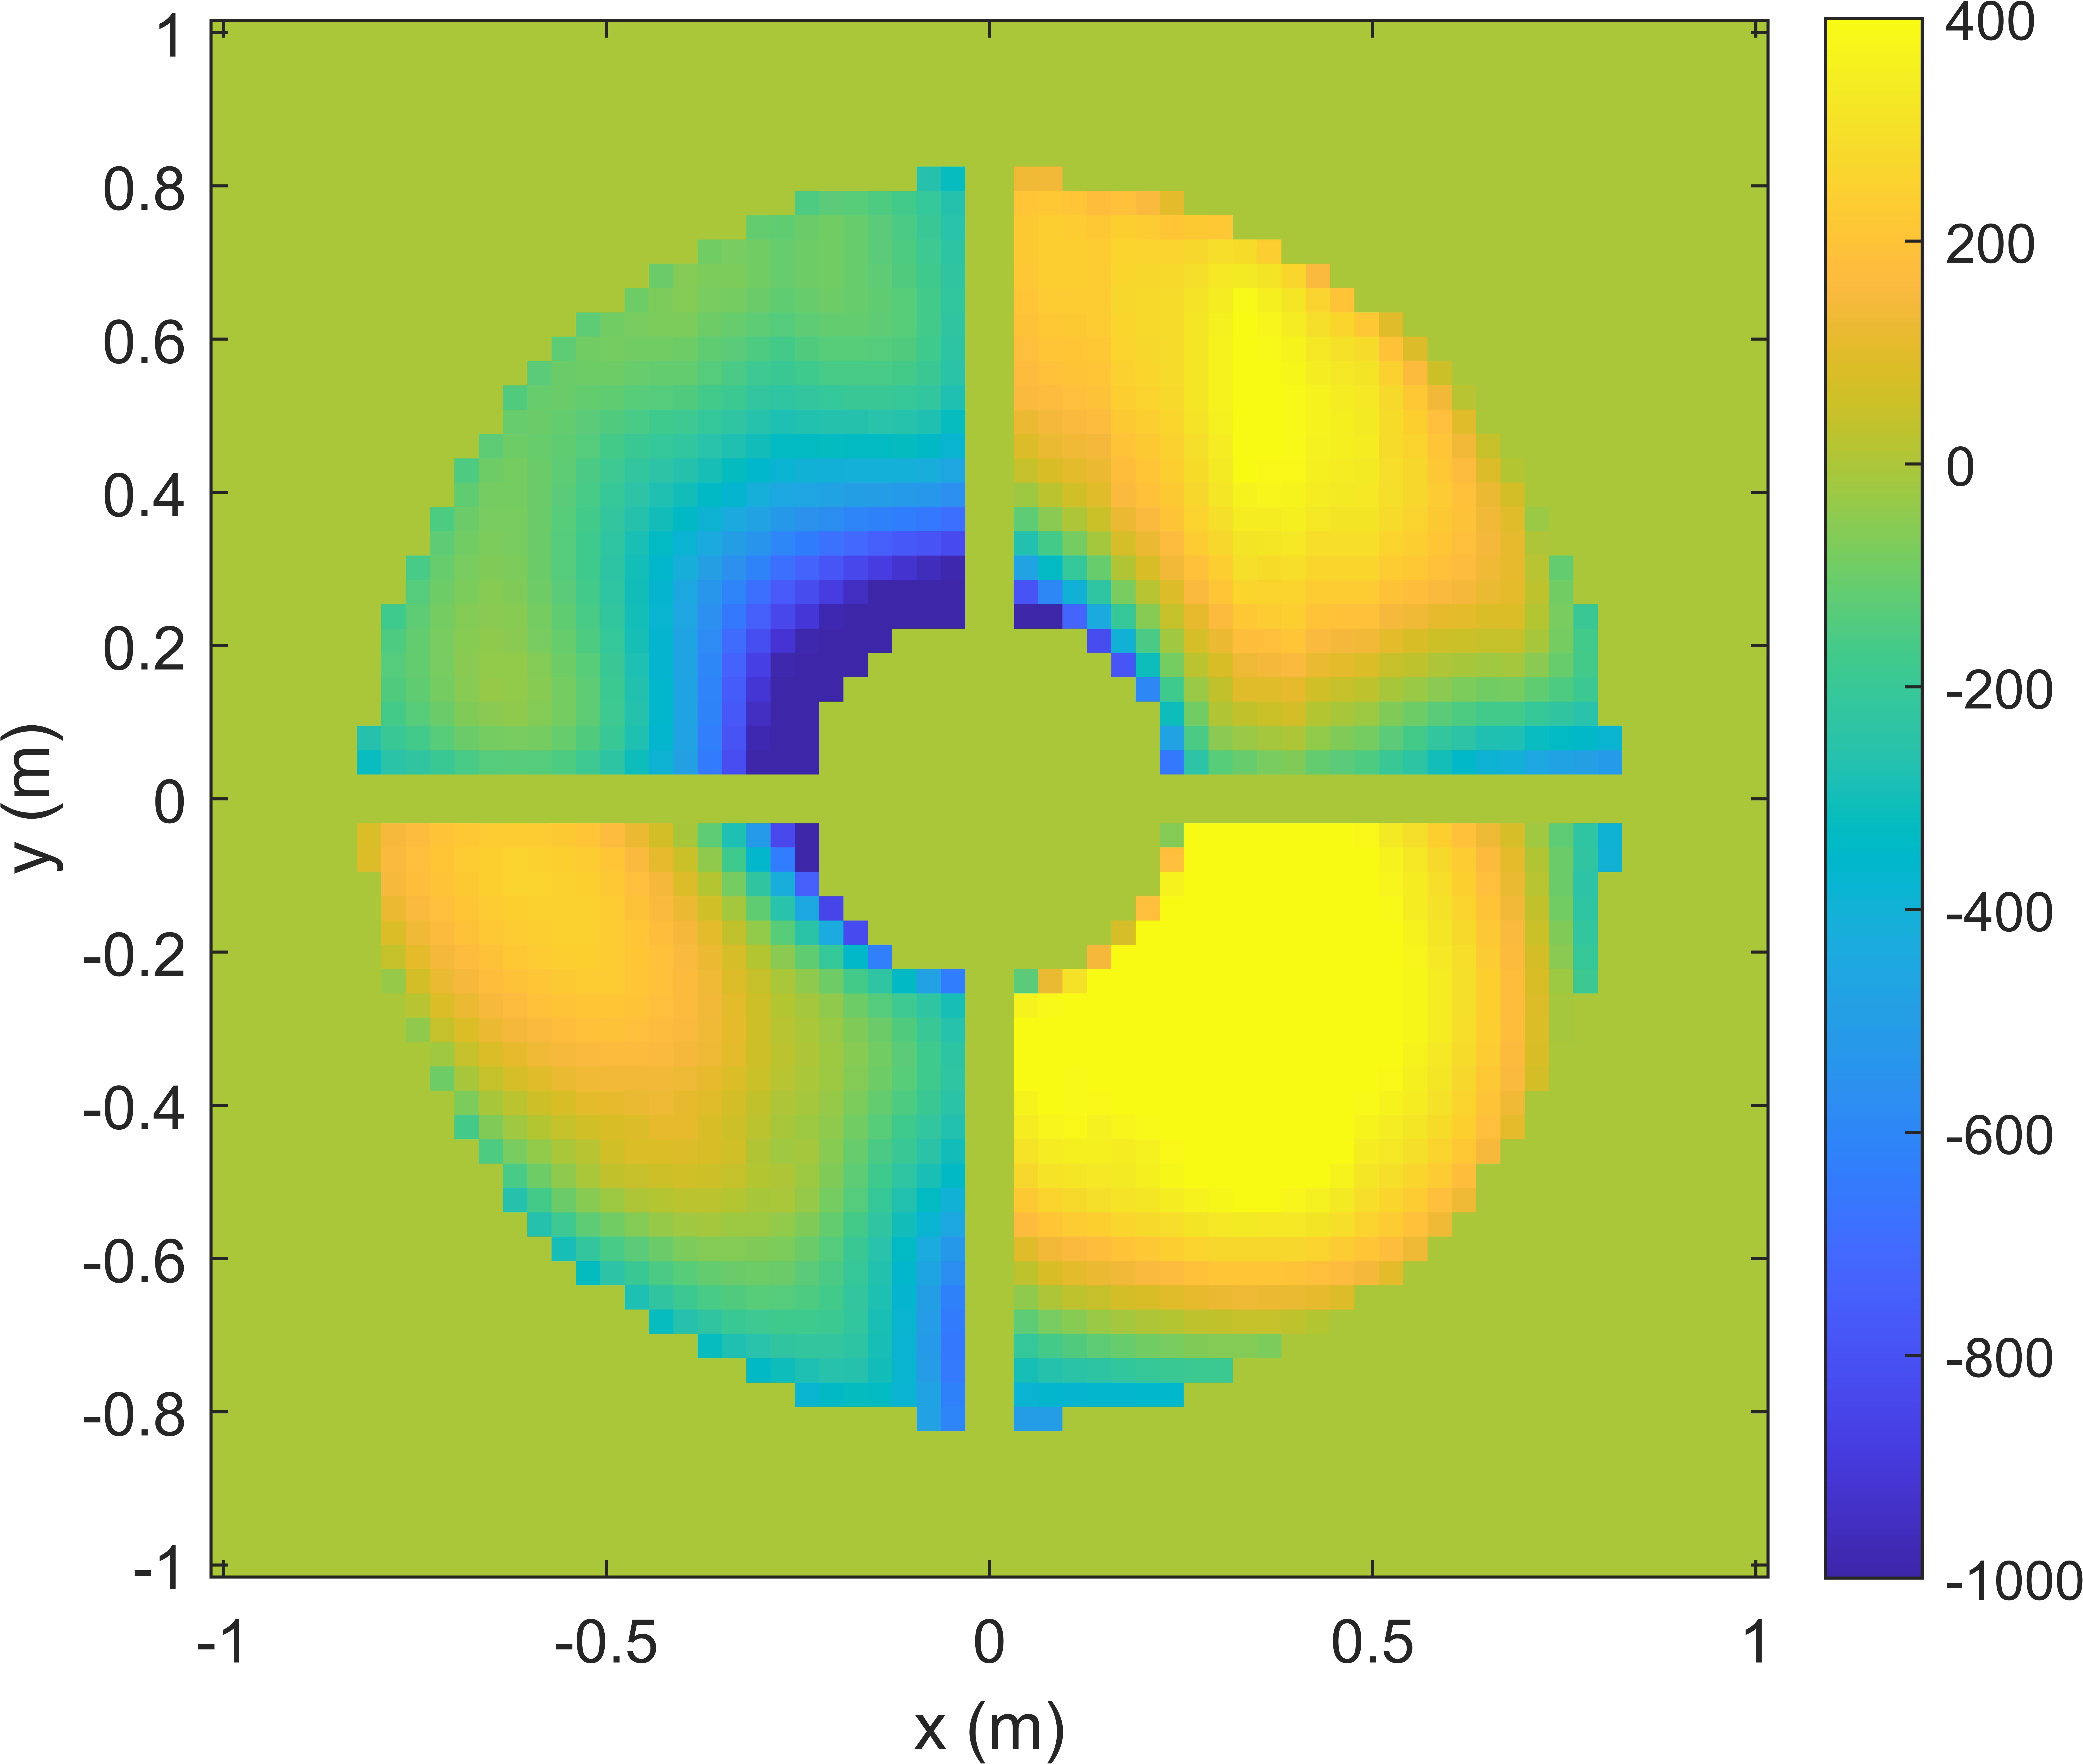
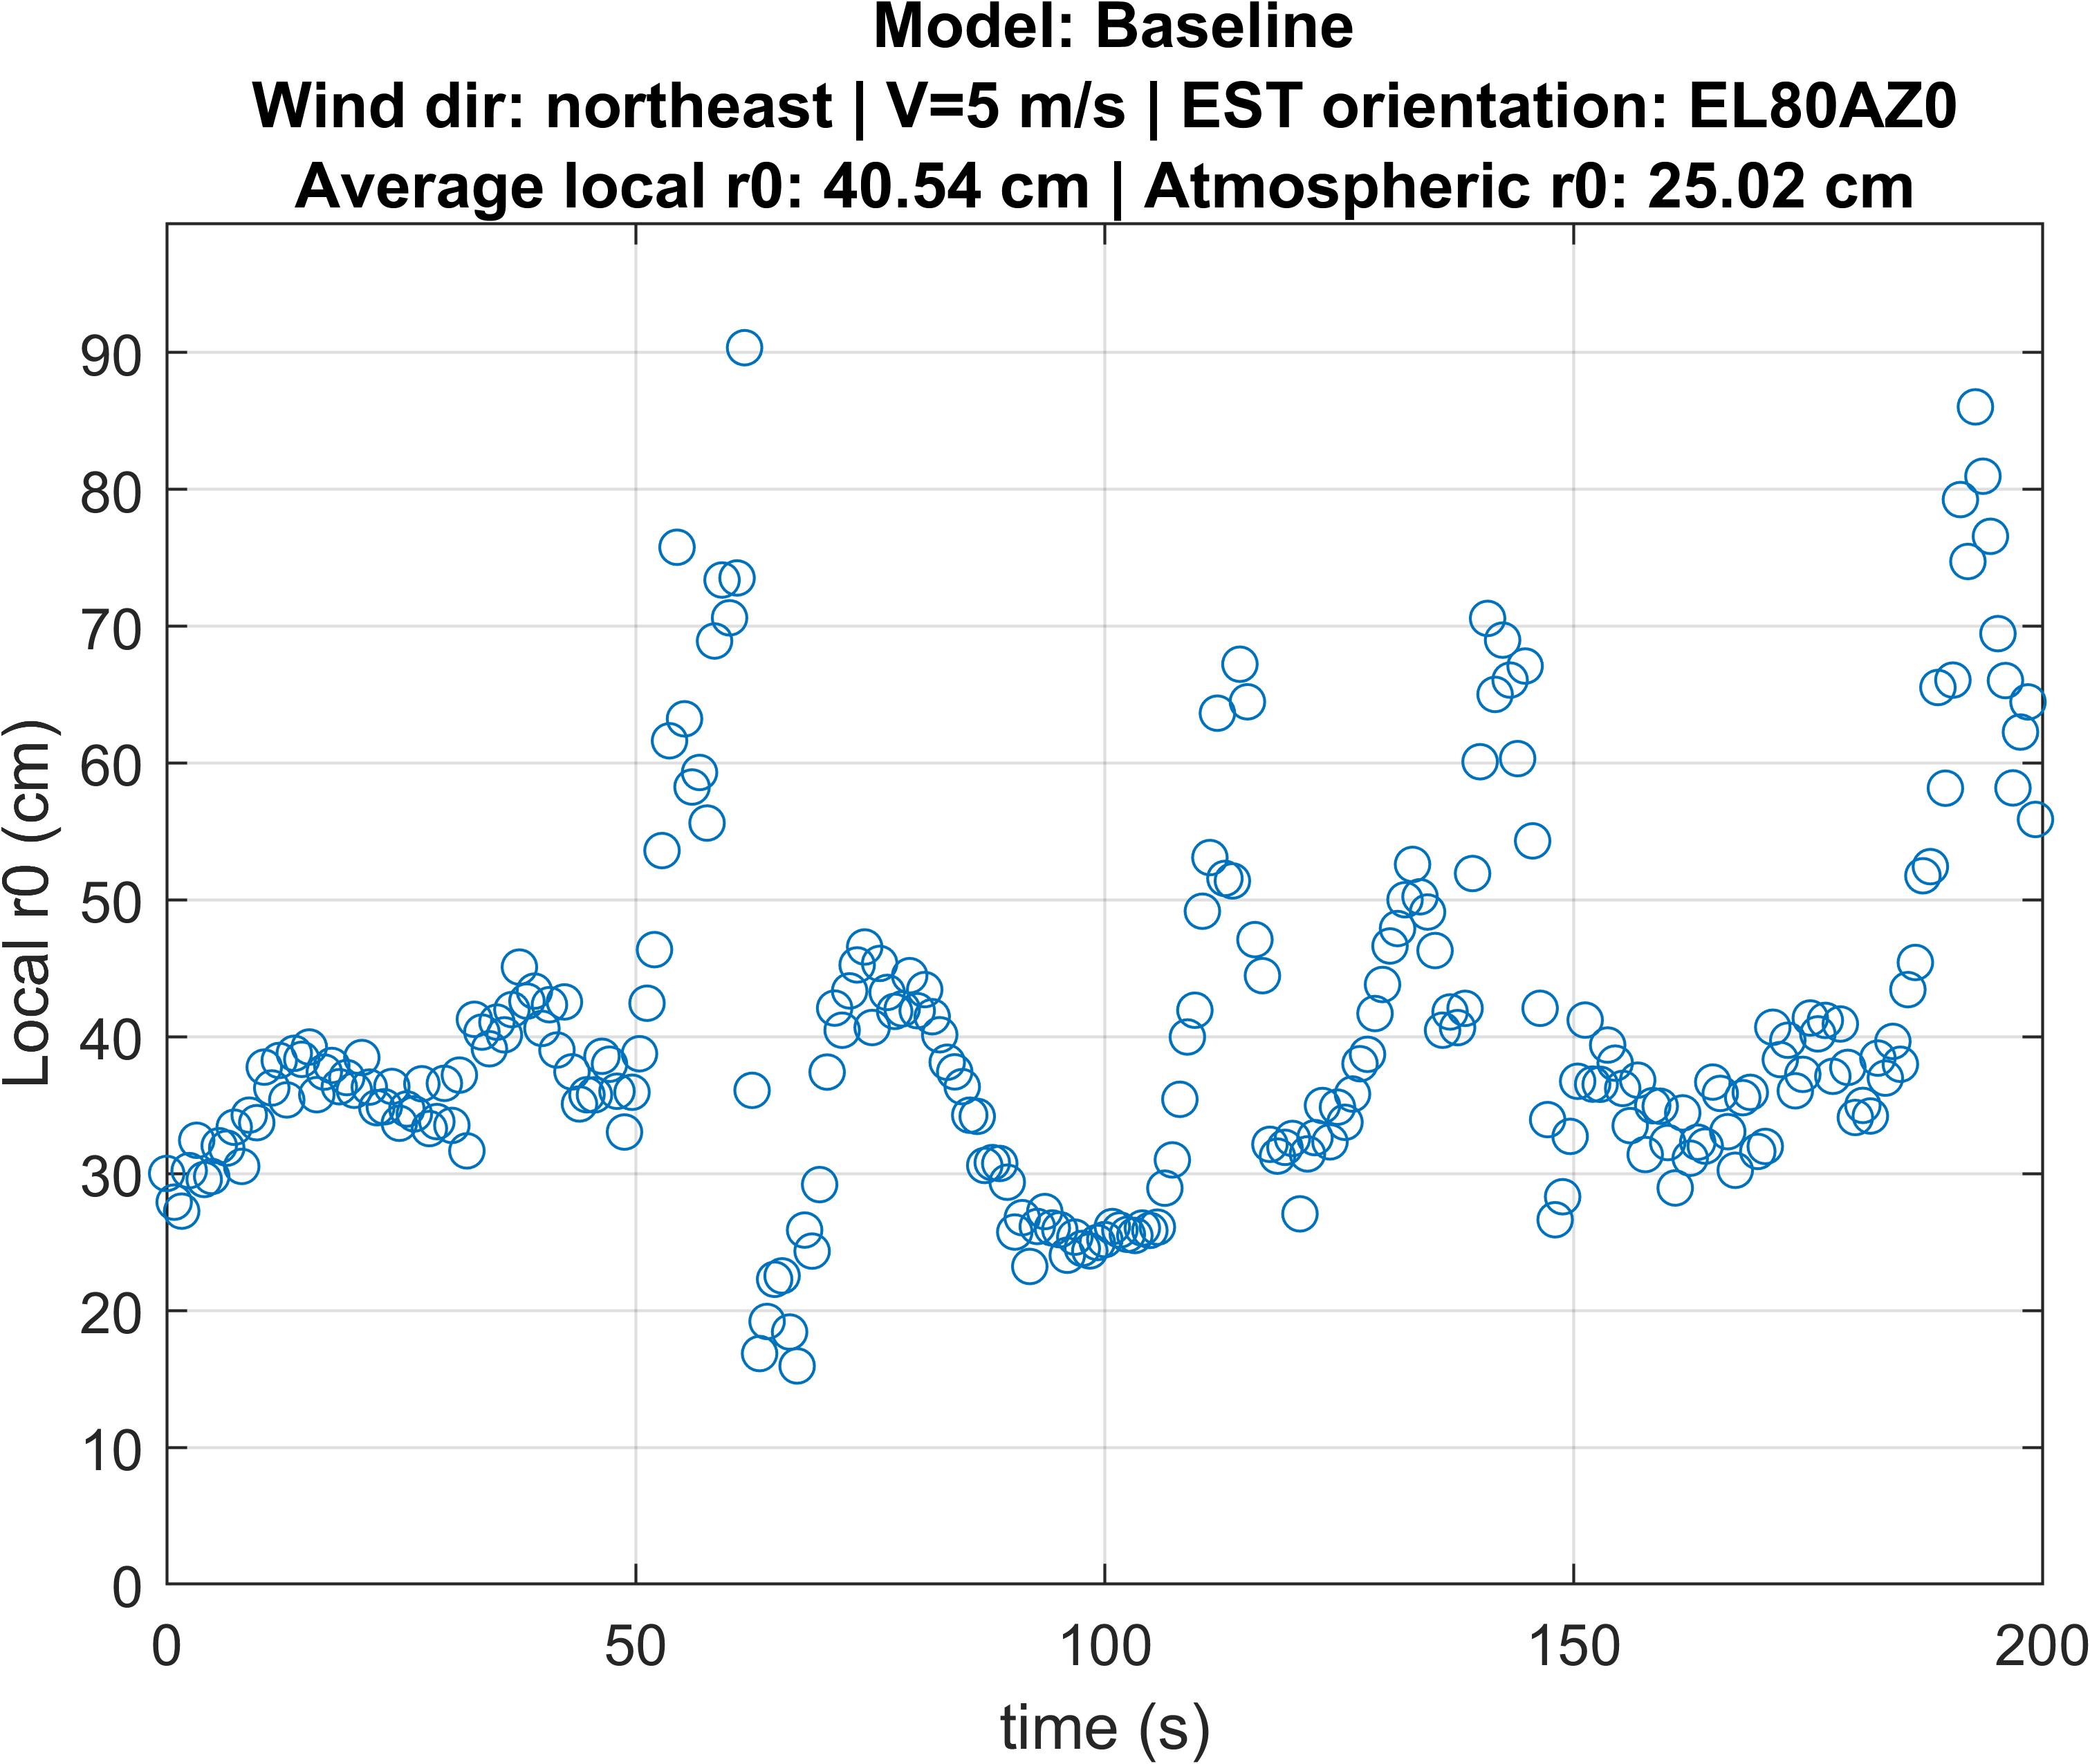
An optical volume of 15 metres from the primary mirror vertex is used to perform the optical analysis. Following the CFD analysis, the temperature of every air cell is used on a post-processing script to calculate several optical variables. These include the Optical Path Length (OPL), the Optical Path Difference (OPD), and ultimately the seeing integrated along the EST optical path. The local seeing variables obtained are the standard ones: Full Width Half Maximum (FWHM) of the seeing disc and the Fried parameter (r0). Figure 3 shows the average OPD in nm and Figure 4 the instantaneous and average Fried parameters for one simulation.

Figure 3. Average OPD (nm) integrated along the optical path.

Figure 4. Local Fried parameter during a 200 s observation.
This methodology is being currently used to perform several trade-off studies of design parameters. They will provide solid knowledge of the main parameters influencing local seeing to optimise the EST design in terms of optical quality before the Preliminary Design Review. The conclusions of those analyses will be used during the Detailed Design Phase as input for every subassembly.
